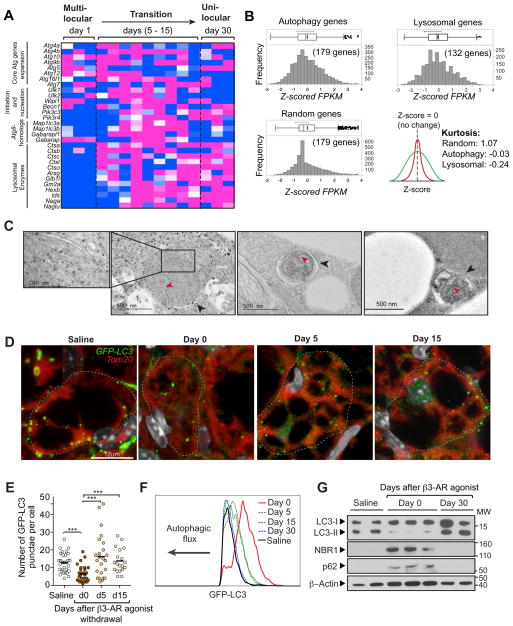
Figure 4. Activation of autophagy during the beige-to-white adipocyte transition.
(A) Expression profile of the autophagy-related genes during the beige-to-white adipocyte transition. The color scale shows z-scored FPKM representing the mRNA level of each gene in blue (low expression)-white-red (high expression) scheme. n = 3 for each time point.
(B) Kurtosis of the autophagy and lysosomal genes in (A). Note that the autophagy and lysosome component genes were platykurtic (K= −0.03 and −0.24, respectively), while randomly selected genes showed mesokurtic distribution (K= 1.07).
(C) Electron microscopy images of beige adipocytes during the transition (days 5 – 30 following β3-AR agonist withdrawal). Black arrowheads indicate the autophagic vesicles containing mitochondrial remnants, as identified by remaining cristae (red arrowheads). Scale bar, 500 nm.
(D) Confocal microscopy images of beige adipocytes from GFP-LC3 mice. GFP-LC3 mice were treated with saline or the β3-AR agonist CL316,243 for seven consecutive days. The inguinal WAT depots were harvested at indicated time points (days 0 – 15) following β3-AR agonist withdrawal. Mitochondria and GFP-LC3-labelled autophagosomes were visualized by immunohistochemistry for Tom20 (red) and GFP (green), respectively. Nuclei are labeled with Hoechst (grey). The image in inset shows co-localization of GFP-LC3 and mitochondria. Scale bar, 12 μm.
(E) Quantification of the GFP-LC3 puncta in (A) at indicated time points. *** P <0.001 by Mann-Whitney U test. n = 20–30 cells per condition.
(F) Autophagic flux in adipocytes from GFP-LC3 mice at indicated time points (days 0 – 30) following β3-AR agonist withdrawal (beige adipocytes) and from GFP-LC3 mice treated with saline (white adipocytes). X-axis represents GFP-LC3 fluorescence intensity and Y-axis represents the number of adipocytes normalized to mode. Data are representatives of two independent experiments.
(G) Immunoblotting for NBR1, p62/SQSTM1, and LC3 (LC3-I and LC3-II) from lysates of adipocytes isolated from the inguinal WAT of wild-type mice treated with saline or the β3-AR agonist CL316,243 (day 0 and 30 following β3-AR agonist withdrawal). β-actin was used as a loading control. Data are representatives of 3 independent experiments. Molecular weight (MW) is shown on the right.

