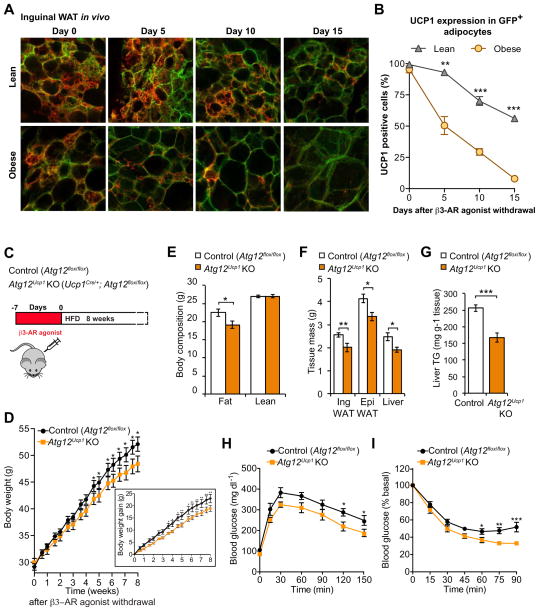
Figure 7. Prolonged maintenance of beige adipocytes by autophagy inhibition protects animals from diet-induced obesity and insulin resistance.
(A) Confocal images of fixed inguinal WAT sections from Ucp1Cre/+;mT/mG reporter mice. Inguinal WAT depots from lean mice under a regular diet (top panel) and age-matched obese mice under a high-fat diet (bottom panel) were immunostained for endogenous UCP1 (Red). Note that the cellular membranes of beige adipocytes were visualized by membrane-targeted GFP (mGFP, Green) of the mT/mG reporter mice. Scale bar, 57 μm.
(B) Quantification of mGFP-positive adipocytes in lean and obese mice that express endogenous UCP1 in (A). n = 100 cells or more per group. ** P <0.01, *** P <0.001 by two-tailed Student’s t-test.
(C) Schematic of the metabolic experiment in control (Atg12flox/flox) and Atg12Ucp1 KO mice. Control and Atg12Ucp1 KO mice were treated with CL316,243 for seven days to induce beige adipocyte biogenesis. Subsequently, the mice were acclimated to thermoneutrality (30 °C) under a high-fat diet for 8 weeks.
(D) Body weight of control (Atg12flox/flox) and Atg12Ucp1 KO mice under a high-fat diet. Body weight was measured twice a week. * P <0.05, ** P <0.01. n = 8 – 10 per genotype. The graph in the inset shows body weight gain of control and Atg12Ucp1 KO mice. Significance was determined by two-way repeated-measures ANOVA followed by Fisher’s LSD test. Data are expressed as means ± s.e.m.
(E) Body composition of control (Atg12flox/flox) and Atg12Ucp1 KO mice from (D) at the end of 8 weeks of high-fat diet. * P <0.05 by two-tailed Student’s t-test. Data are expressed as means ± s.e.m.
(F) Tissue weight of inguinal WAT, epididymal WAT, and liver from control (Atg12flox/flox) and Atg12Ucp1 KO mice from (D) after 9 weeks of high fat diet. * P <0.05, ** P <0.01. Data are expressed as means ± s.e.m.
(G) Liver triglyceride levels in control (Atg12flox/flox) and Atg12Ucp1 KO mice after 9 weeks of high fat diet. *** P <0.001. Data are expressed as means ± s.e.m.
(H) After 8 weeks of high-fat diet, control (Atg12flox/flox) and Atg12Ucp1 KO mice were fasted for 12 hours and injected with 1.5g kg−1 glucose. Whole-body glucose was measured at 15, 30, 60, 90, 120, and 150 min. * P <0.05, n = 6 – 8 per genotype. Significance was determined by two-way repeated-measures ANOVA followed by Fisher’s LSD test. Data are expressed as means ± s.e.m.
(I) After 8.5 weeks of high fat diet diet, control (Atg12flox/flox) and Atg12Ucp1 KO mice were fasted for 3 hours and injected with 0.75 U kg−1 insulin. Whole-body glucose was measured at 15, 30, 45, 60, 75, and 90 min. * P <0.05, ** P <0.01, *** P <0.001, n = 7–8 per genotype. Significance was determined by two-way repeated-measures ANOVA followed by Fisher’s LSD test. Data are expressed as means ± s.e.m.

