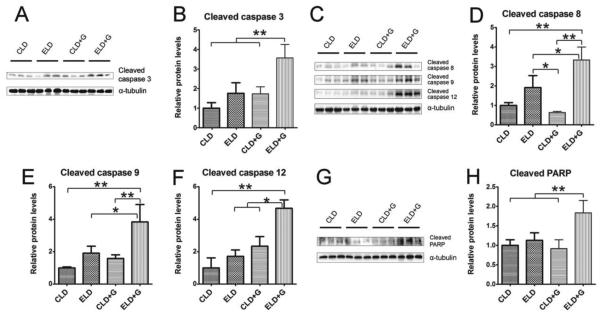
Figure 2. Ethanol-induced caspase activation in the pancreas.
Mice were divided into four groups as described in Fig. 1. Six hours after the last ethanol treatment, mice were sacrificed and the pancreas was processed for immunoblotting analysis of cleaved caspase-3, caspase-8, caspase-9, caspase-12 and PARP (A, C and G). The expression of these proteins was quantified and normalized to the expression of α-tubulin (B, D, E, F and H). Each data point was the mean ± SEM of three independent experiments. * denotes significant difference (p < 0.05). ** denotes significant difference (p < 0.01).

