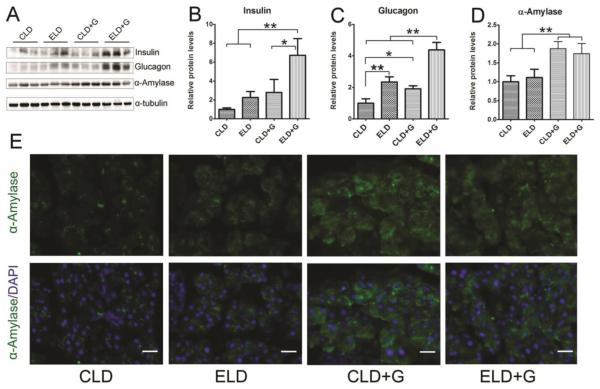
Figure 5. Effect of ethanol on pancreatic levels of glucose, insulin, glucagon and amylase.
Six hours after the last ethanol treatment, mice were sacrificed and the pancreas was removed and analyzed for the expression of glucose, insulin, glucagon and amylase by immunoblotting (A). The expression of these proteins was quantified and normalized to the expression of α-tubulin (B-D). Each data point was the mean ± SEM of three animals. * denotes significant difference (p < 0.05). ** denotes significant difference (p < 0.01). The expression of α-amylase was also examined by immunofluorescent staining (E). Bar = 50 µm

