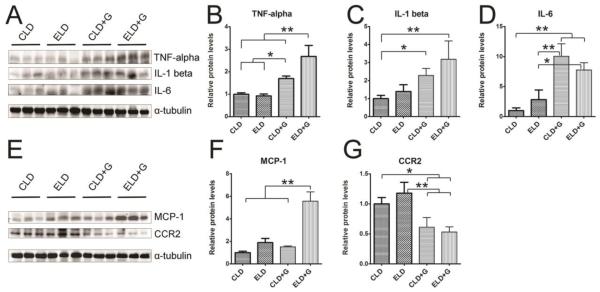
Figure 7. Ethanol-induced increase in the expression pancreatic cytokines and chemokines.
Six hours after the last ethanol treatment, mice were sacrificed and the pancreas was removed and analyzed for the expression of TNFα, IL-1β, IL-6, MCP-1 and CCR2 by immunoblotting (A and E). The expression of these cytokines and chemokines was quantified and normalized to the expression of α-tubulin (B, C, D, F and G). Each data point was the mean ± SEM of three animals. * denotes statistical difference (p<0.05) and ** denotes significant difference (p<0.01).

