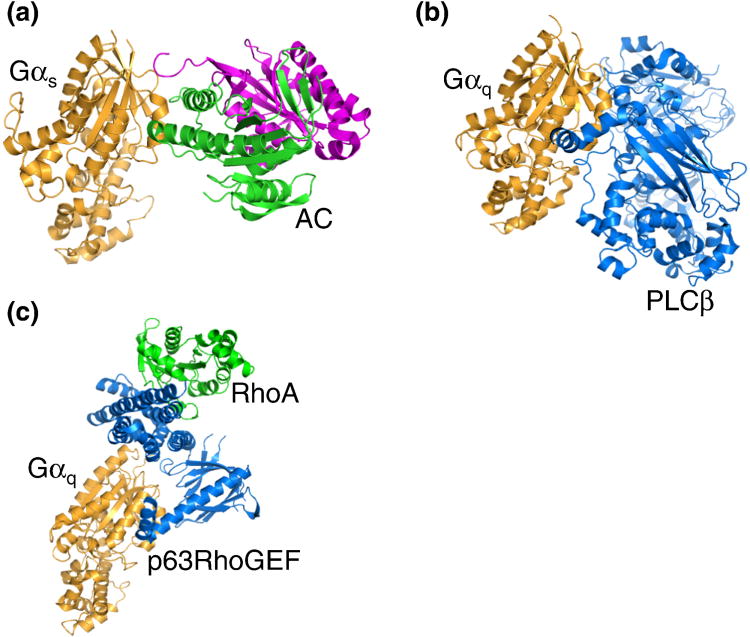
Figure 10.
Crystal structures of Gα in complex with different downstream effectors. (a) Cartoon representation of Gαs (orange) with adenylyl cyclase (AC) C1A (magenta) and C2A domains (green). (b) Representation of Gαq (orange) with phospholipase Cβ3(blue). (c) Representation of Gαq (orange) with p63RhoGEF (blue) and RhoA (green).

