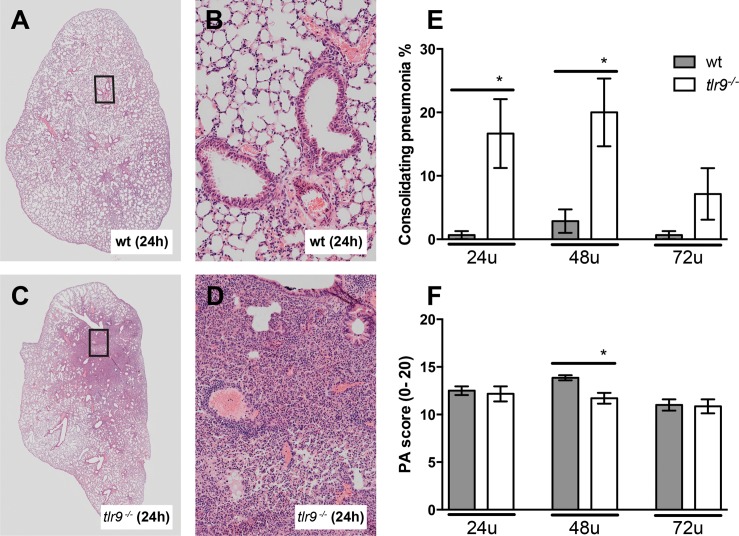
Figure 5.
Tlr9−/− mice show more consolidating pneumonia after induction of S. aureus pneumonia. Representative slides of lung HE staining of (A, B) Wt mice and (C, D) tlr9−/− mice. (A, C) depiction of a whole lung section; (B, D) ×200 magnification. (E) Consolidating pneumonia and (F) total pathology scores were determined at the indicated time points post infection in Wt mice (gray) and tlr9−/− mice (white) according to the scoring system described in the online supplement. Data are expressed as bar diagrams depicting mean ± standard error (n = 7–8 mice per group at each time point). *p < 0.05 versus Wt mice at the same time point.

