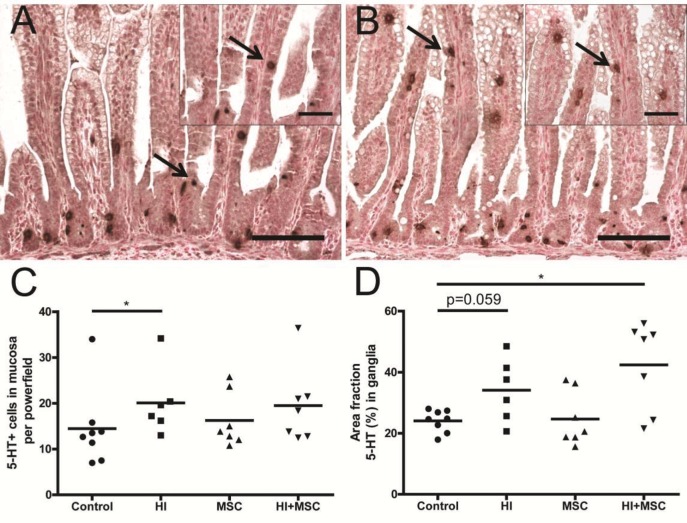
Figure 10.
Increased 5-HT in fetal intestinal mucosa 7 d after HI. Representative intestinal sections of (A) control and (B) HI animals were stained by immunohistochemistry for 5-HT. For each experimental group, 5-HT+ cells (arrows) in mucosa (C) were counted and the 5-HT-positive area in myenteric ganglia (D) was measured. The mean cell counts in mucosa and area fraction (%) per ganglion per animal are given. The scale bar in panels represents 100 μm. The scale bar in insets represents 50 μm. *p < 0.05. Significance between control and HI group in panel D was tested by t test, and p value is given.

