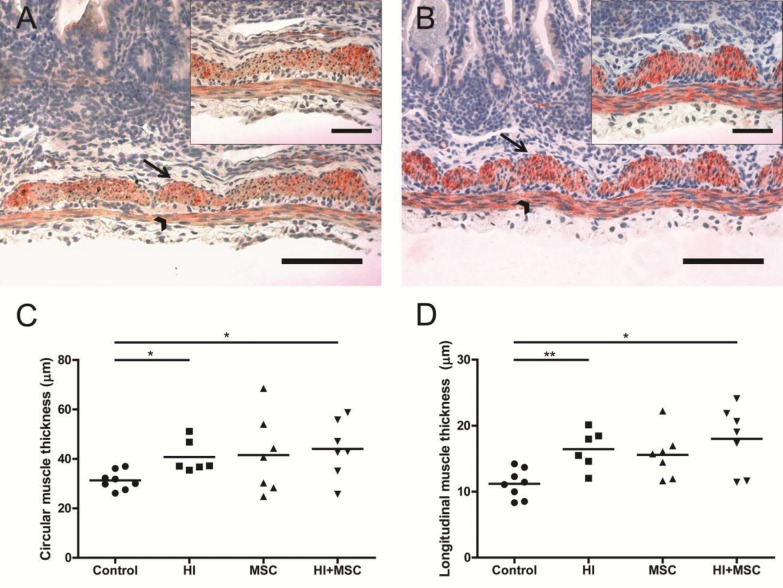
Figure 5.
Increased thickness of the longitudinal and circular muscle layers 7 d after HI. Representative intestinal sections of (A) control and (B) HI animals were stained by immunohistochemistry for SMA22 (red). For each experimental group, muscle thickness in (C) circular (arrow) and (D) longitudinal (arrowhead) muscle layers was measured and the mean thickness per power field per animal is given. The scale bar in panels A and B represents 100 μm. The scale bar in insets represents 50 μm. *p < 0.05, **p < 0.01.

