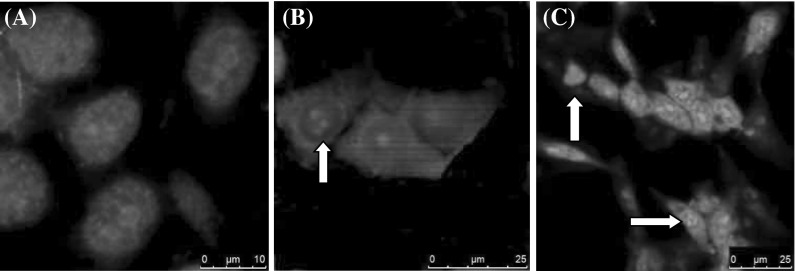
Fig. 4.
H-Ras 5RP7 cells were exposed to IC50 concentration of silver nitrate during 24 h. Apoptotic cell morphology was detected using DAPI staining. The image was generated by Leica TCS-SP5 confocal microscopy. Control cells (a) with no visible changes (×40). Apoptotic morphology (nuclear fragmentation and chromosome condensation) was observed at panels b (×40) and c (×20) (arrows), respectively. Bar a 10 µm, b 25 µm, c 50 µm

