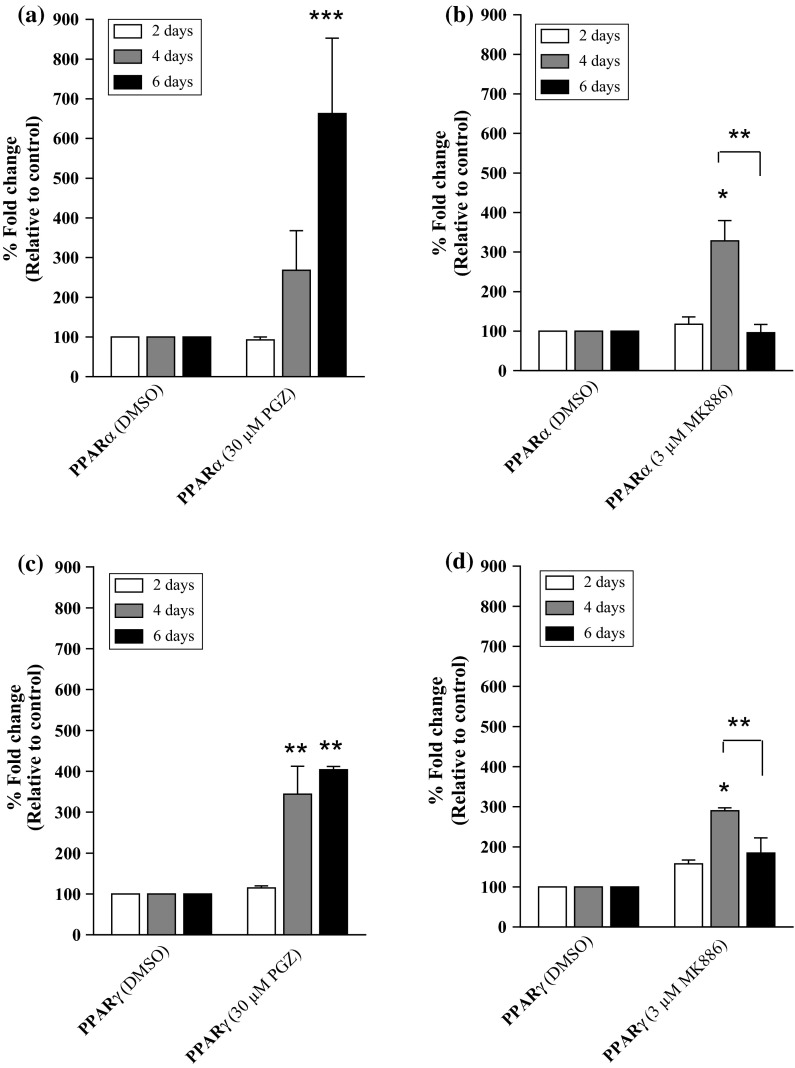
Fig. 1.
The expression of PPARs in MDA-MB-231 cells. The mRNA expression levels of PPARα in MDA-MB-231 cells treated with different concentrations of a PGZ and b MK886 for 2, 4 and 6 days. The mRNA expression levels of PPARγ in MDA-MB-231 cells treated with different concentrations of c PGZ and d MK886 for 2, 4 and 6 days. DMSO was used as a diluent control for the study. Data are shown as the mean ± SEM of triplicate cultures, *p < 0.05; **p < 0.01; ***p < 0.001

