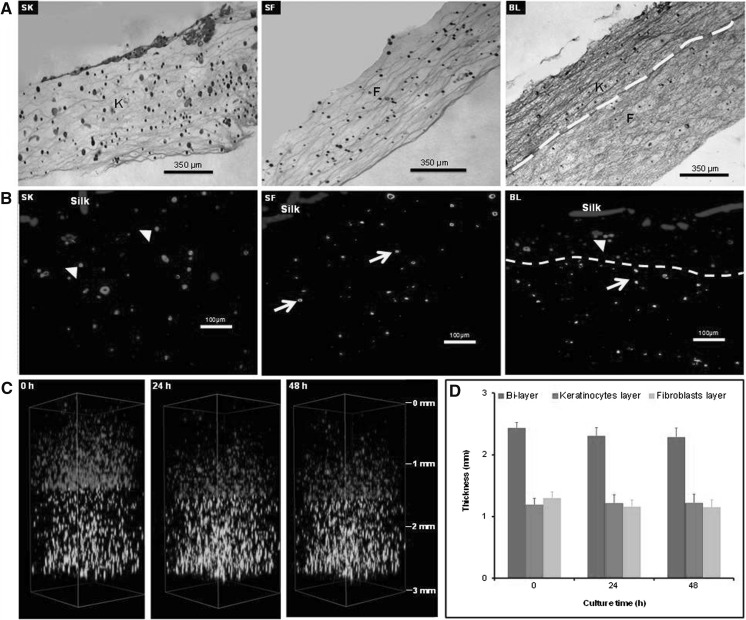
Fig. 1.
Histological analysis of single layer keratinocytes (SK), single layer fibroblasts (SF), bilayer (BL) substitutes (a H&E, b IHC). The distribution of keratinocytes (K) and fibroblast (F) in all substitutes is homogenous and keratinocytes positively express Cytokeratin 14 (red) whilst fibroblast positively express Collagen type 1 (green) in immunohistochemistry staining (yellow arrow fibroblast, arrow heads keratinocytes, yellow line demarcation of keratinocyte-fibroblast layer). c 3D images of BL substitute at different time points; 0, 1 and 2 days. d Quantitative evaluation of thickness of different layers at time point of 0, 1 and 2 days. Data are mean ± SEM for n = 3 (scale in mm). (Color figure online)

