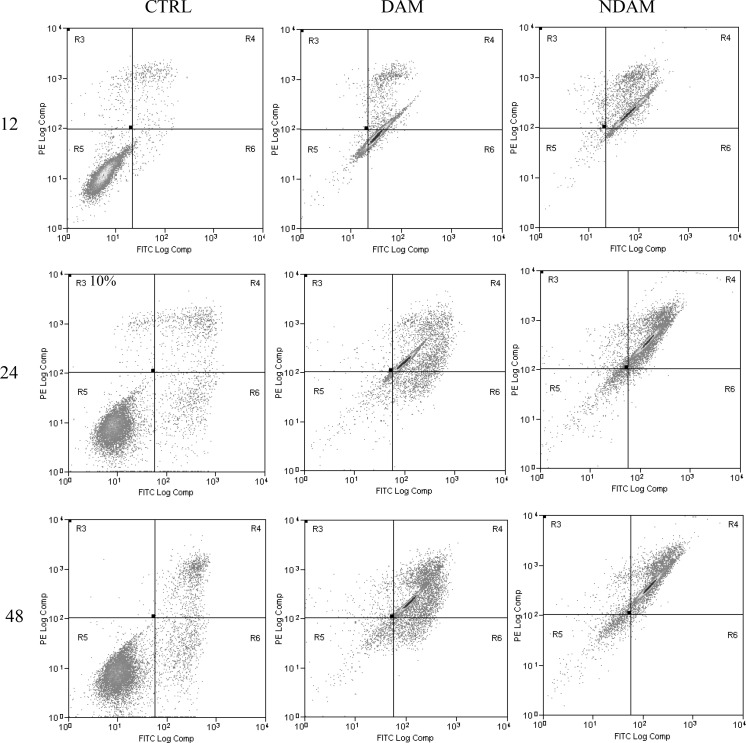
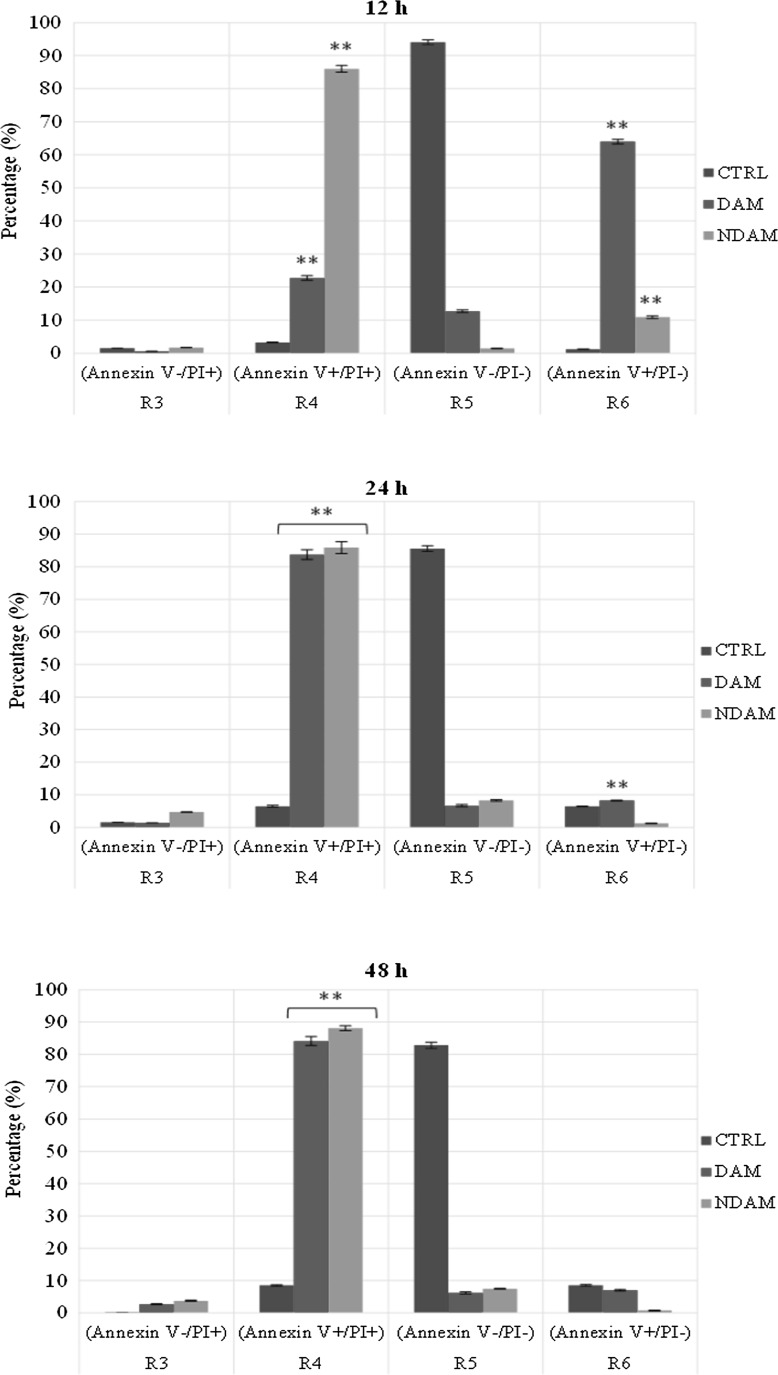
Fig. 3.
Flow cytometric analysis of apoptosis in H400 cells treated with IC50 concentration of DAM and NDAM for 12, 24 and 48 h using FITC-annexin V/PI double staining. Early and late apoptosis were examined on fluorescence 2 (FL2 for propidium iodide) versus fluorescence 1 (FL1 for Annexin) plots. Images are representative of three independent experiments. R3 damaged/dead cells, R4 late apoptotic/secondary necrotic cells, R5 viable cells and R6 early apoptotic cells. Statistically significant differences between control and treated cells were set at **P < 0.01


