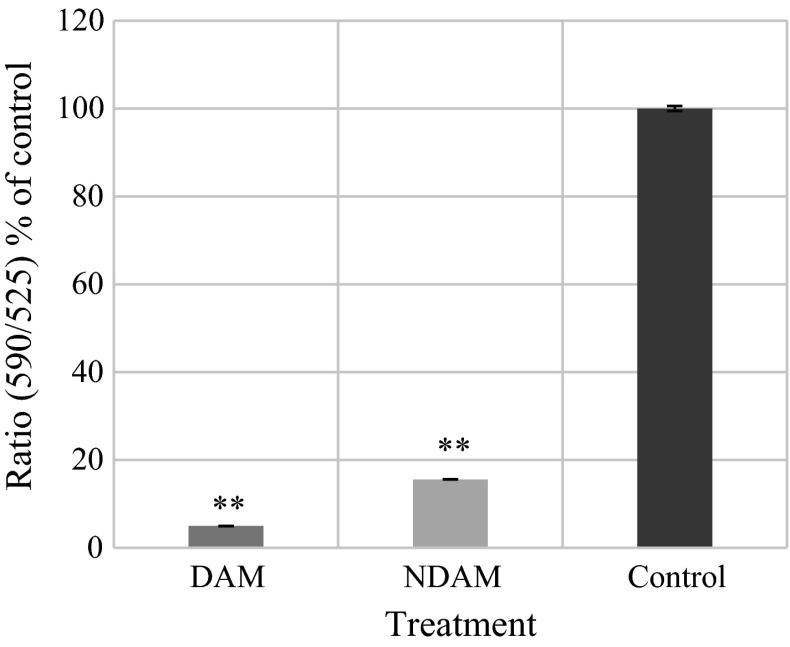
Fig. 5.
Mitochondrial membrane potential disruption in H400 cells treated with IC50 concentration of DAM and NDAM for 24 h. Data are presented as mean ± SEM from three individual experiments (n = 3). Statistically significant differences between control and treated cells were set at *P < 0.05, **P < 0.01

