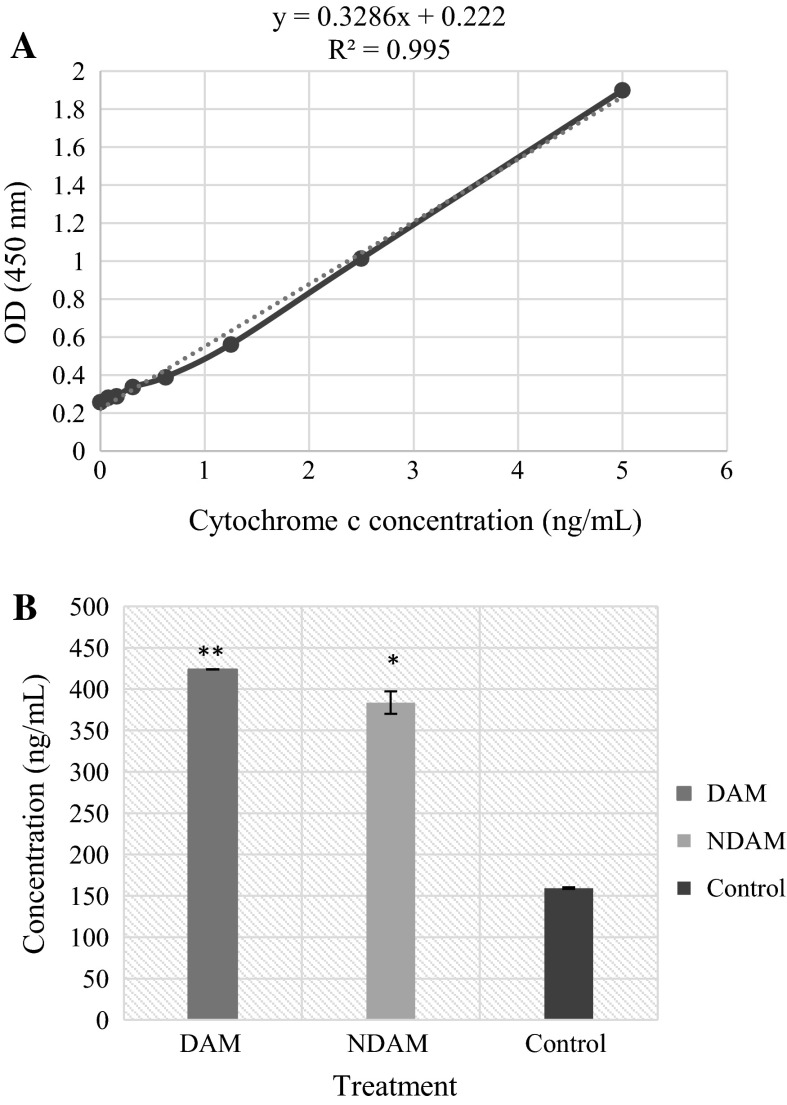
Fig. 6.
a Standard curve associated with Cytochrome c concentration in the samples. Natural Cytochrome c from cell lysate was serially diluted (0–5 ng/mL) in Standard Diluent Buffer. The optical density (OD) of each dilution was plotted against the Cytochrome c standard curve. Parallelism of Cytochrome c demonstrated by the figure, showed that the standard precisely reflected Cytochrome c content in the samples. Linear regression analysis provided a correlation coefficient of 0.995. b Quantitative detection of Cytochrome c in cell lysates of H400 OSCC cells treated with IC50 concentration of DAM and NDAM for 24 h. Cytochrome c levels were examined in duplicate using ELISA kit. Data are shown as mean ± SEM of two independent experiments. Significant difference from the control was at *P < 0.05, **P < 0.01

