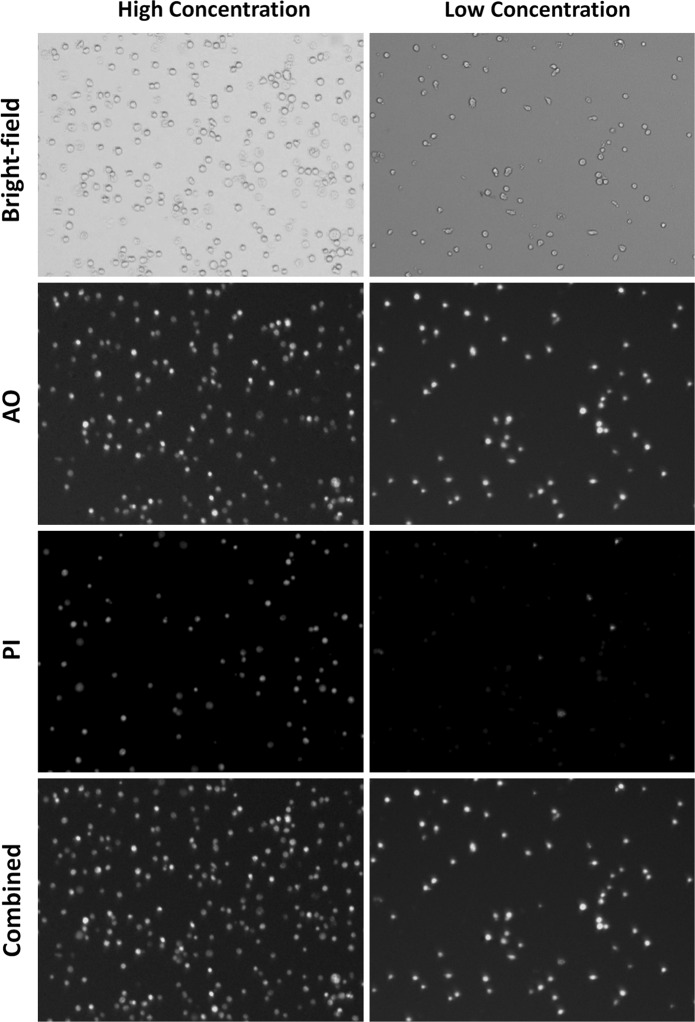
Fig. 1.
Bright-field and fluorescent images captured on Celigo image cytometer. The bright-field images showed outlines of Jurkat cells in the wells. The AO (pseudo-color green) and PI (pseudo-color red) fluorescent images showed more cells in the high concentration samples for both AO and PI positive Jurkat cells. The combined image showed that there was minimum optical cross-talk between the AO and PI fluorescence. (Color figure online)

