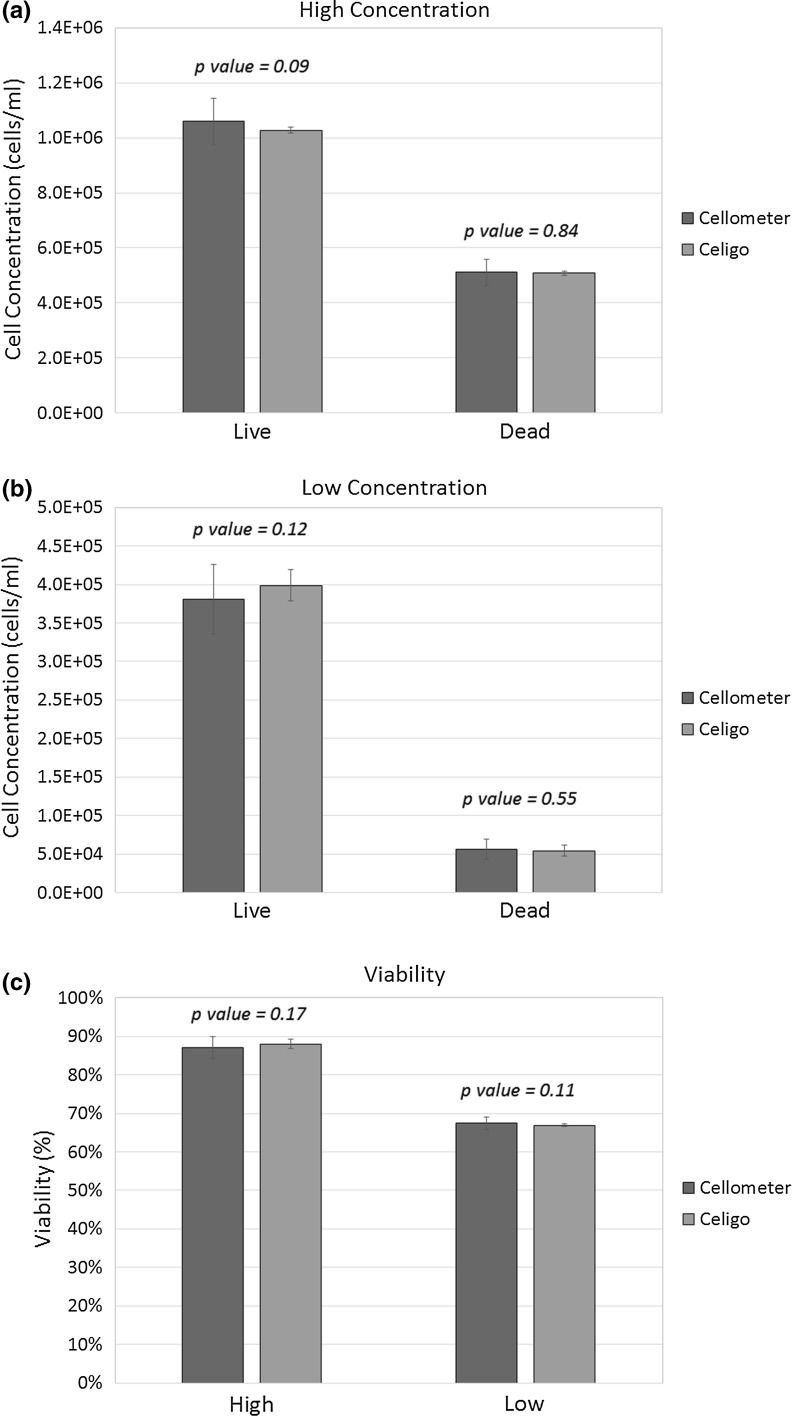
Fig. 2.
Comparison of Jurkat cell concentration and viability measurement for high and low concentration samples between Cellometer and Celigo image cytometers. a High and b low Jurkat cell concentration results showing comparable measurement between the two systems. It is important to note that the error bars for Celigo are much lower than those for Cellometer due to the fact that Celigo analyzes a larger number of cell samples. c Viability comparison also showed comparable results and smaller error for Celigo. The calculated p values was greater than 0.05 for all the comparison results indicating that they are statistically the same. (Color figure online)

