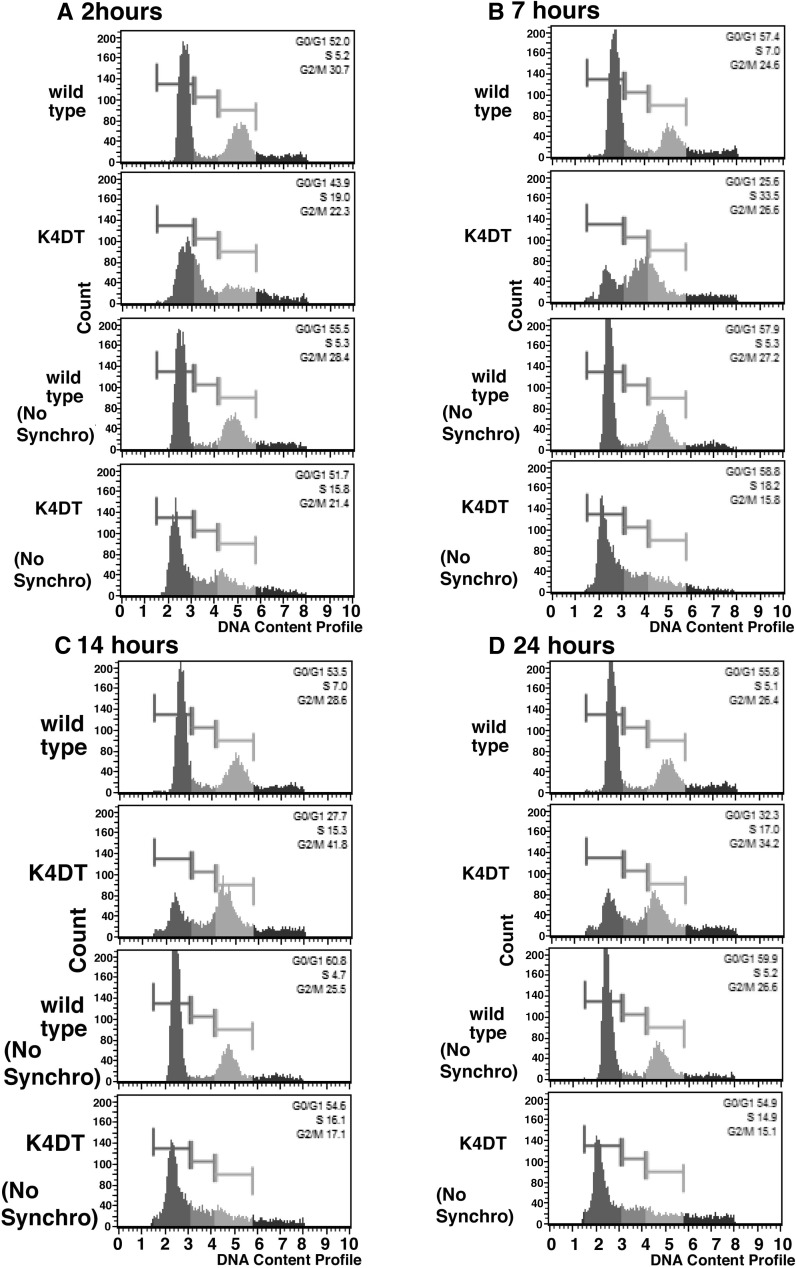
Fig. 6.
Cell cycle analysis after the cell synchronization with Nocodazole and Aphidicolin. a Representative results of 2 h from release. b Results of 7 h from release. c Results of 14 h from release. d Results of 24 h from release. Wild type and K4DT cells were synchronized into G1 phase with Nocodazole and Aphidicolin treatment. Note that K4DT showed good cell synchronization, while wild type did not. No synchronization means that these cells were not treated with Nocodazole and Aphidicolin

