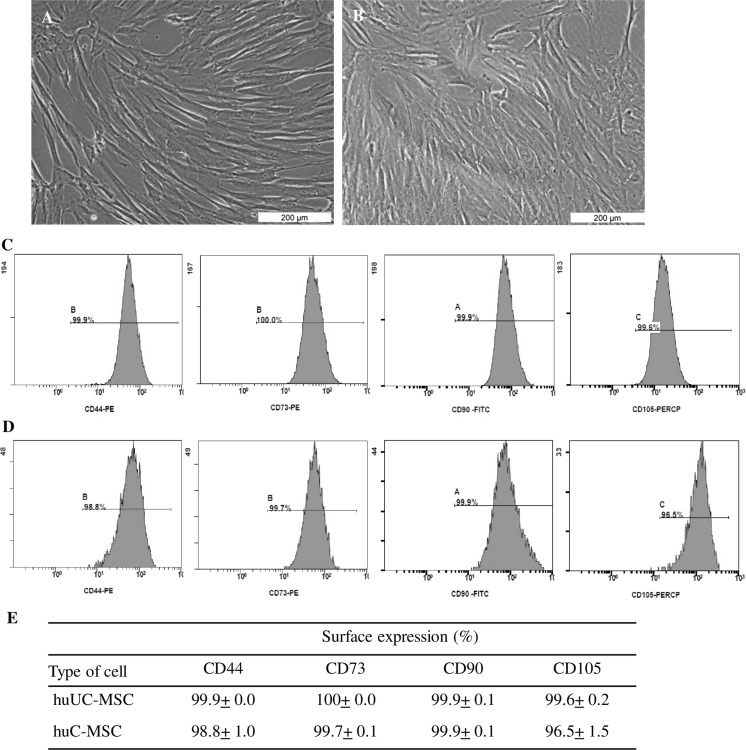
Fig. 1.
Characterization of mesenchymal stem cells (MSC) derived from human umbilical cord and heart biopsy. a, b Images are showing morphology of adherent hUC-MSC and hC-MSC. c Flow Cytometry analysis showing the immunophenotype of hUC-MSC and hC-MSC. Upper panel histogram shows the expression of positive markers for hUC-MSC. d Lower panel histogram shows the expression of positive markers for hC-MSC. e The table shows the mean value of percentage of positive cells (±) standard deviation to the total number of sample analyzed (n = 3). Cells used in this analysis were obtained from the homogenous confluent monolayer at the end of third/fourth passage. The picture was taken using phase contrast microscope at 100× magnification. Scale bar = 200 μm

