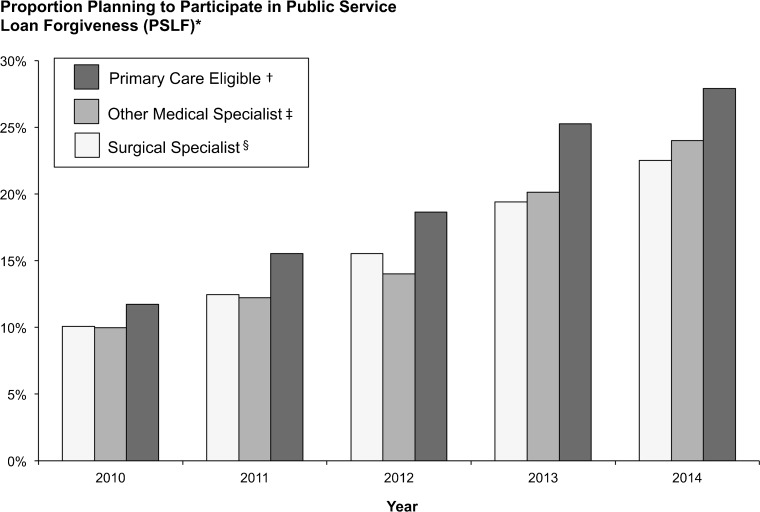
Figure 1.
Planned Public Service Loan Forgiveness Participation by Specialty, 2010–2014. * Data are from the Association of American Medical Colleges Graduation Questionnaire, 2010–2014. Response Rates: 2010 = 83 %, 2011 = 78 %, 2012 = 79 %, 2013 = 82 %, and 2014 = 82 %. † Primary care eligible specialties include family medicine, pediatrics, internal medicine, medicine/pediatrics, and preventive medicine. The intended use among primary care eligible specialties is greater when compared to other medical specialties (p < 0.01) and surgical specialties (p < 0.01) within each year of the data set. ‡ Other medical specialties include allergy/immunology, dermatology, emergency medicine, medical genetics, neurology, pathology, physical medicine and rehabilitation, psychiatry, radiology, radiation oncology, hospice and palliative medicine, and a 75 % random sample of internal medicine and internal medicine/pediatrics. § Surgical specialties include anesthesiology, colon and rectal surgery, general surgery, neurological surgery, obstetrics and gynecology, ophthalmology, orthopedics, otolaryngology, plastic surgery, thoracic surgery, and urology.

