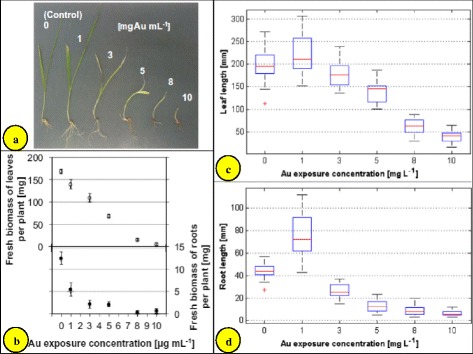
Fig. 4.

Concentration-dependent effects of gold nanoparticle exposure on Hordeum vulgare after 2 weeks of exposure. a Photos of barley seedlings, b fresh biomass of leaves (empty symbols) and roots (filled symbols) of barley plants (mean ± one standard deviation for three individual batches with four to ten barley seedlings each), c leaf lengths, and d root lengths of barley plants (box plots represent median values including 14–21 individual data sets per concentration; bars give minimum and maximum values excluding outliers marked as red crosses) [24]
