
Fig. 1.
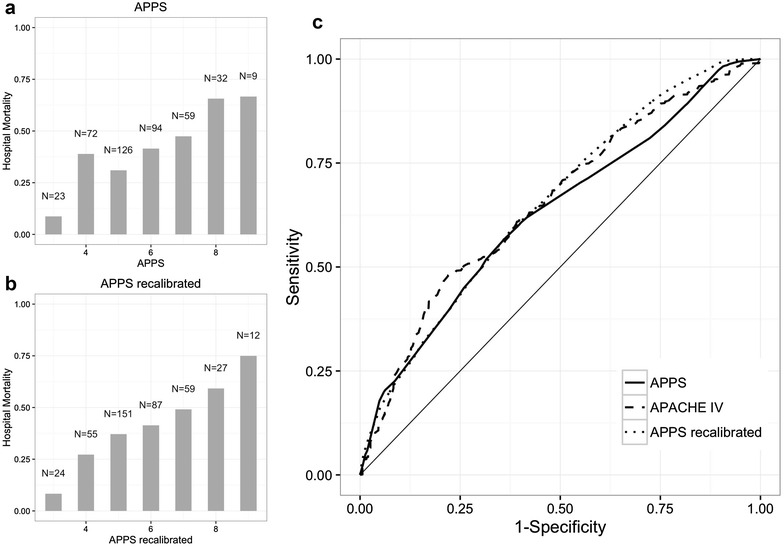
Calibration and predictive accuracy of the APPS for hospital mortality. a Original APPS. b Recalibrated APPS. c ROC curves. Each bar represents the percentage of patients that did not survive that hospital admission. The number indicates the total number of patients with that APPS