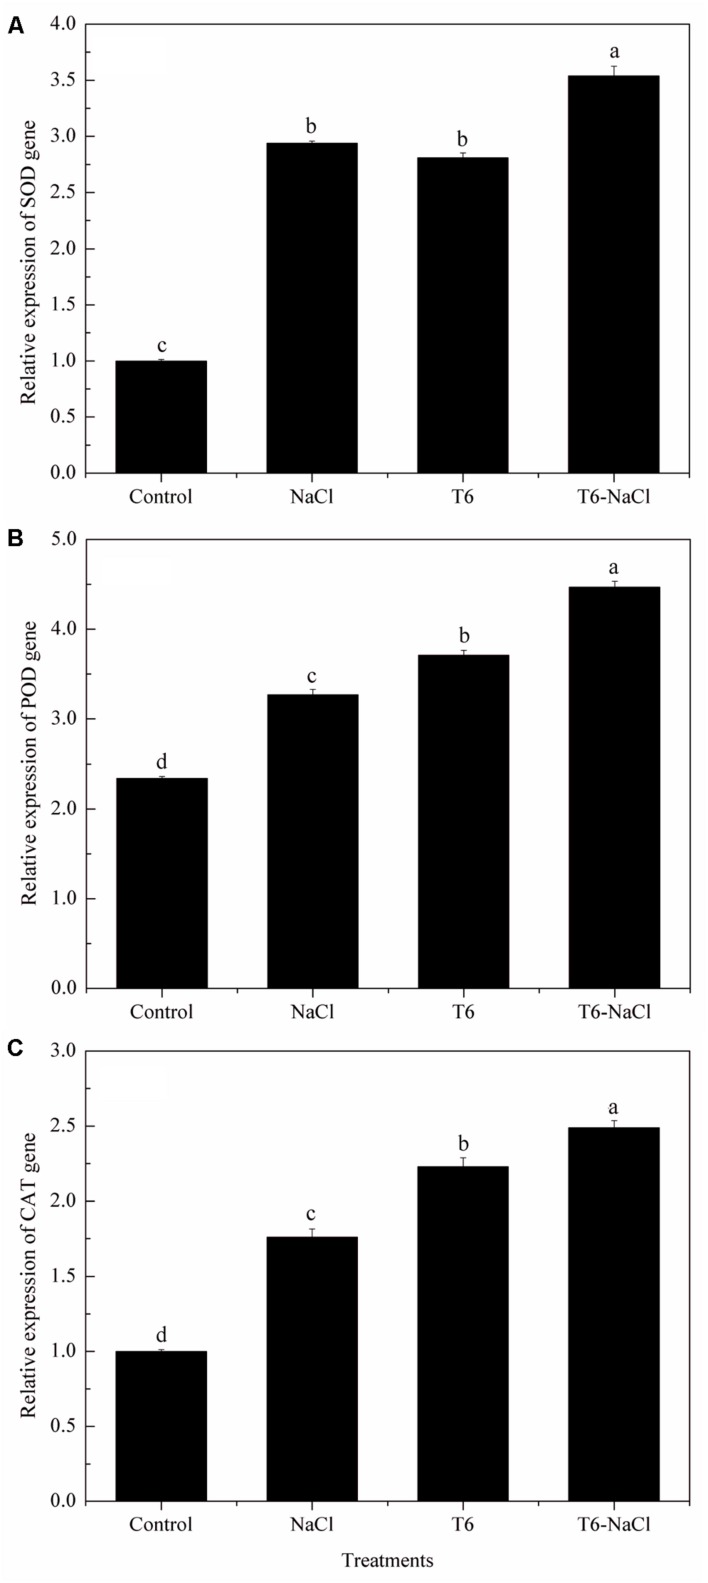
FIGURE 3.
Effect of T. longibrachiatum T6 on the genes of (A) SOD, (B) POD, and (C) CAT expression in the leaves of wheat seedlings under salt stress. Small bars represent the standard errors of the means (n = 12). Different lowercase letters indicate significant differences at P < 0.05 in Duncan’s multiple range test using one-way ANOVA. The treatment names are detailed in the footnote of Table 2.

