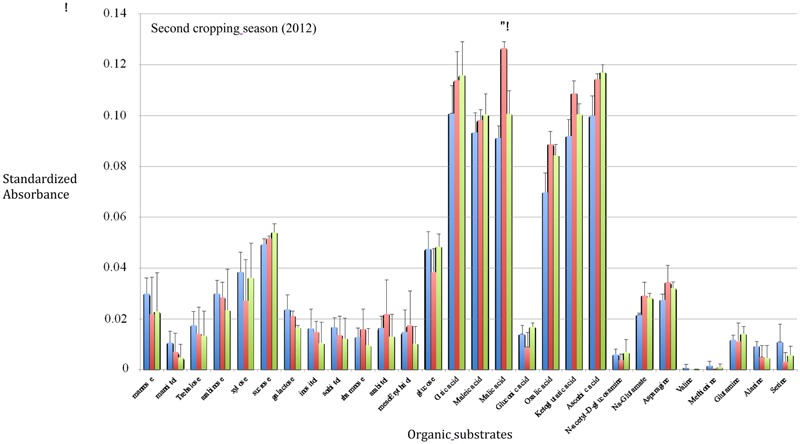
FIGURE 2.

In situ catabolic potential profiles after the second growing season (2012–2013). Error bars represent standard errors (n = 4). Blue bars: wheat monoculture (W); Red bars: wheat/Faba bean intercropping (WF); Green bars: Faba bean/wheat rotation (W+F). An asterisk indicates a significant difference between the WF treatment and the others according to the Newman–Keul’s test (P < 0.05).
