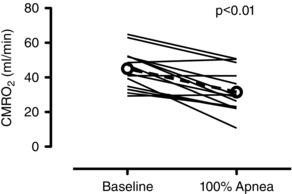
Figure 2. Individual data of the absolute CMRO2 before the apnoea (baseline) and at apnoea termination (100% apnoea) .

Dashed line with open circles denotes mean data. Compared to baseline, the CMRO2 was reduced by ∼29% at 100% of the apnoea (P < 0.01, d = 1.18).
