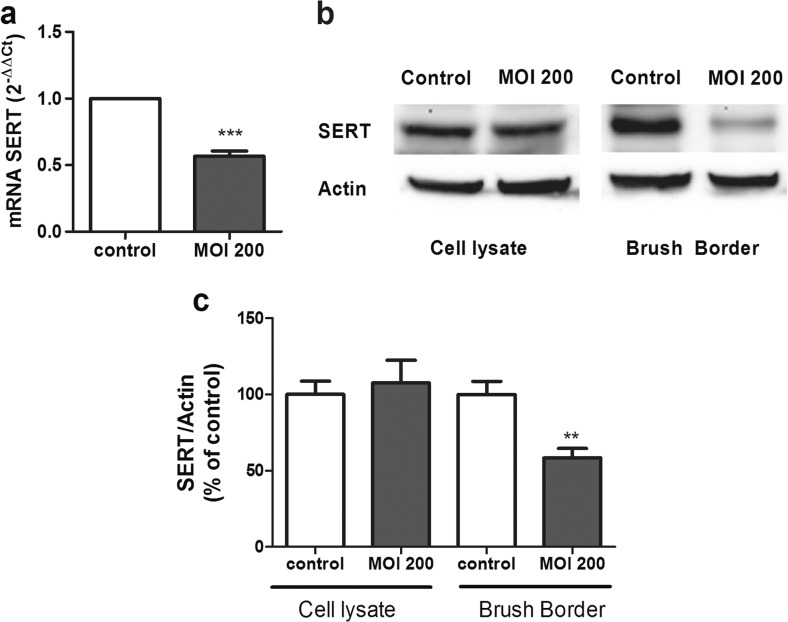
Fig. 2.
L. monocytogenes inhibit SERT mRNA and protein expression. a Quantitative RT-PCR analysis of SERT mRNA expression in cells infected with L. monocytogenes for 2 h at MOI 200. Relative quantification was performed using comparative Ct (2−ΔΔCt) of three biological replicates in five independent experiments (n = 15). Results are expressed as arbitrary units of control = 1. ***P < 0.001 compared with the control value. b Immunodetection of SERT by western blot in cell lysate and brush border from Caco-2/TC7 cells infected with L. monocytogenes for 2 h at MOI 200. c Quantification of SERT protein in both cell lysate and brush border using β-actin as an internal control of the protein load (SERT/β-actin ratio). The results are expressed as a percentage of the control value and are the mean ± SEM of two biological replicates in five independent experiments (n = 10). **P < 0.01 compared with the control value

