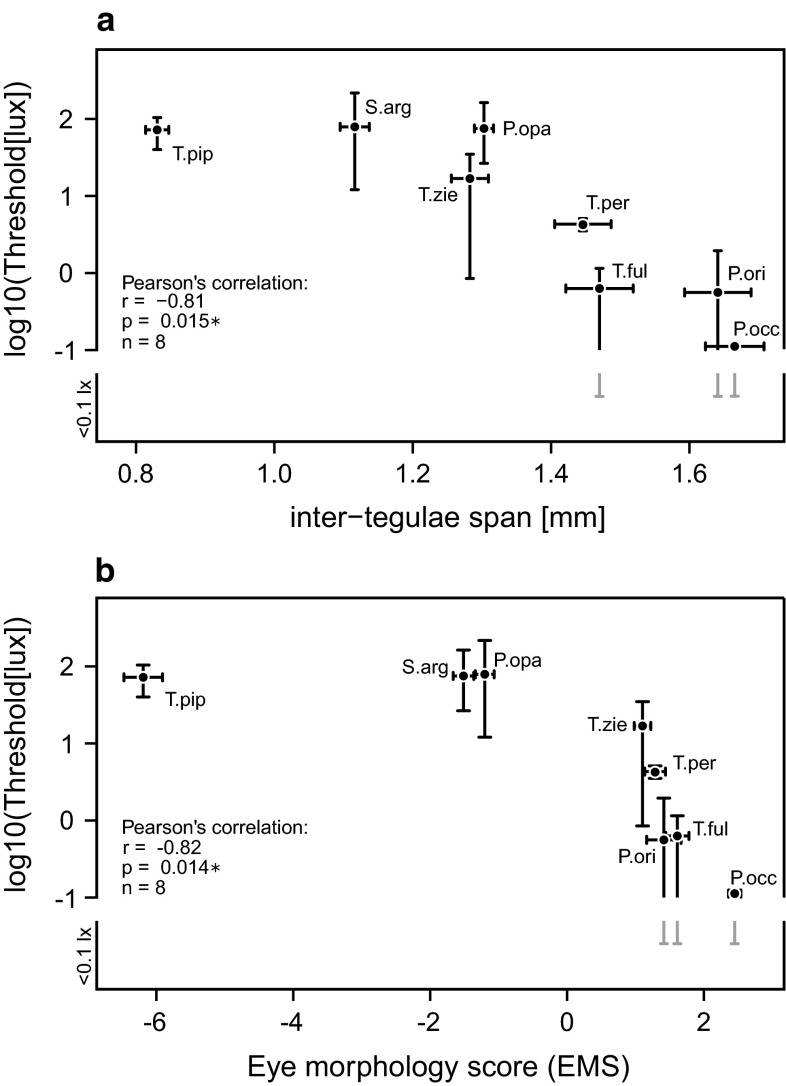
Fig. 2.
Light intensity threshold plotted as a function of a body size and b eye morphology. Light thresholds significantly correlated with both parameters. Eye morphology is expressed as the first principal score of a PCA analysis of all measured morphological eye parameters. PC1 explains 96.7 % of the variance in the dataset. Values represent means. The horizontal error bars indicate the standard deviation of body size and eye morphology, while the vertical error bars represent the total range of observed individual threshold values for each species. Note that the vertical error bars are asymmetric due to the logarithmic scaling of the y-axis. For three species, we observed flight activity below the sensitivity of our lux meter, which is indicated by a break in the negative error bar

