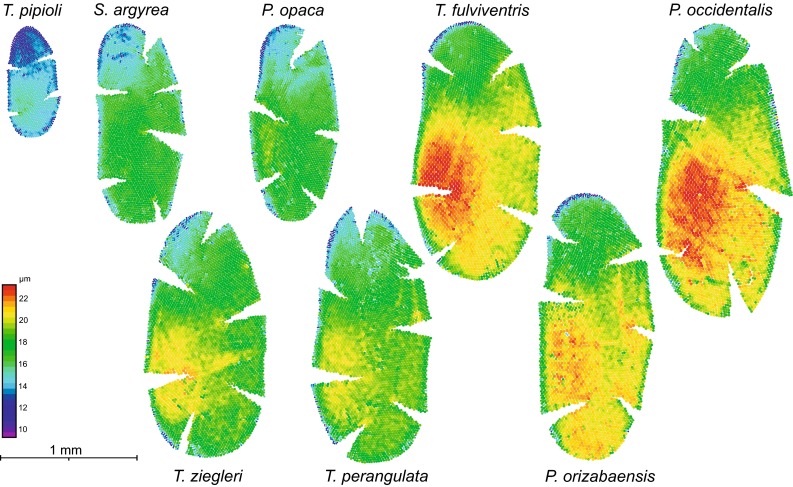
Fig. 3.

Eye maps of the investigated species. The eye maps illustrate eye size and facet size distribution of all investigated species in ascending order of body size (from left to right). Each circle represents a single ommatidium, where the size and color indicate facet diameter (false color scales on the left side). The largest facets are usually found in the fronto-ventral region of the eye. All eye maps are to scale and shown in the same orientation (left-frontal, right-lateral; left eye)
