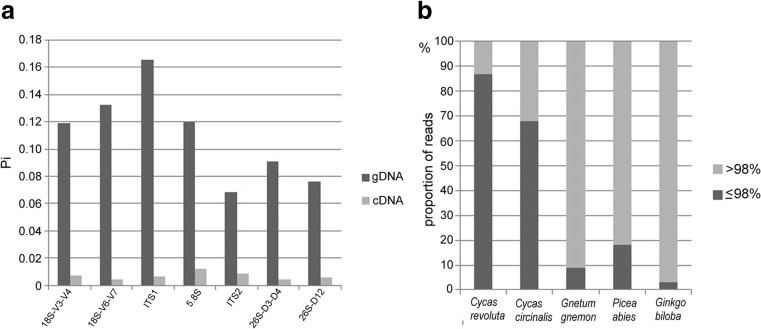
Fig. 5.
a Bar charts showing intragenomic diversity of genomic (gDNA) and transcriptomic (cDNA) reads in Cycas revoluta. The Pi values were calculated from aligned reads. The alignments comprised >150 reads for each subregion. b Bar charts showing the proportion of functional genes (light grey > 98 % sequence identity to consensus cDNA sequence) to pseudogenes (dark grey ≤ 98 % sequence identity) in the genomes of five gymnosperm species

