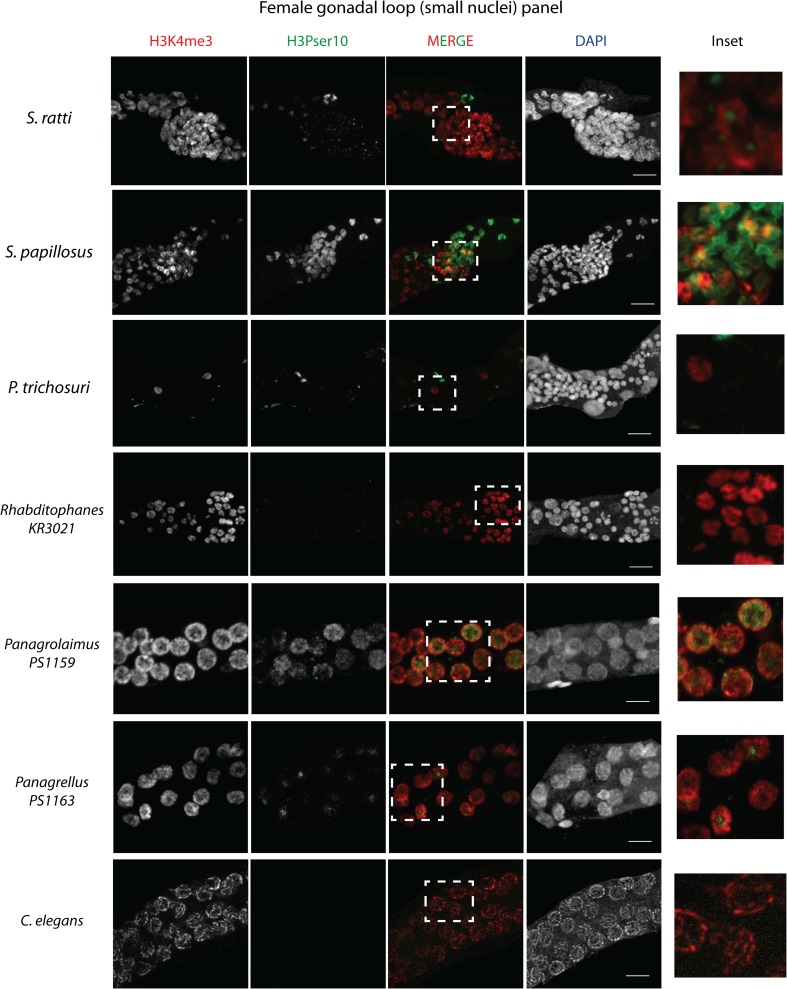
Fig. 7.
H3K4me3 and H3Pser10 staining patterns in females of different nematode species. A comparative image showing H3K4me3 (in red) and H3Pser10 (in green) staining patterns (individual channels are separated according to color and labeled on top) obtained in the same seven nematode species in the gonadal loop region (for orientation, distal gonad arm is to the left for each). This region consists of the small compact nuclei in Strongyloides species. Insets (extreme right) are magnified views of the indicated regions that are marked in white in the merge panels, showing co-localization patterns of H3K4me3 and H3Pser10 in each species. Note the localized dot-like H3Pser10 staining in the nuclei of S. ratti and Panagrellus PS1163, but its even distribution in the nuclei in S. papillosus and Panagrolaimus PS1159. H3Pser10 is absent in P. trichosuri (signal is from somatic sheath cells), Rhabditophanes KR3021 and C. elegans. Scale bar 10 μm

