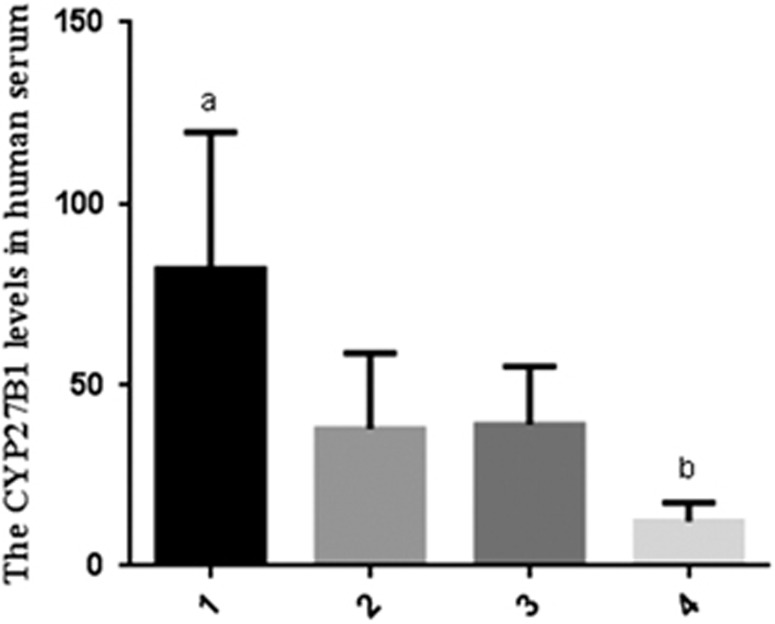
Figure 2.
Comparison of serum CYP27B1 values in the normal pregnant group (1), the PL group (2), the non-gravid group 1 (3) and the non-gravid group 2 (4). a: Significantly higher compared with the PL group, the non-gravid group 1 and the non-gravid group 2 (P=0.000, 0.000 and 0.000, respectively). b: Significantly lower compared with the PL group and the non-gravid group 1 (P=0.000 and 0.000, respectively).

