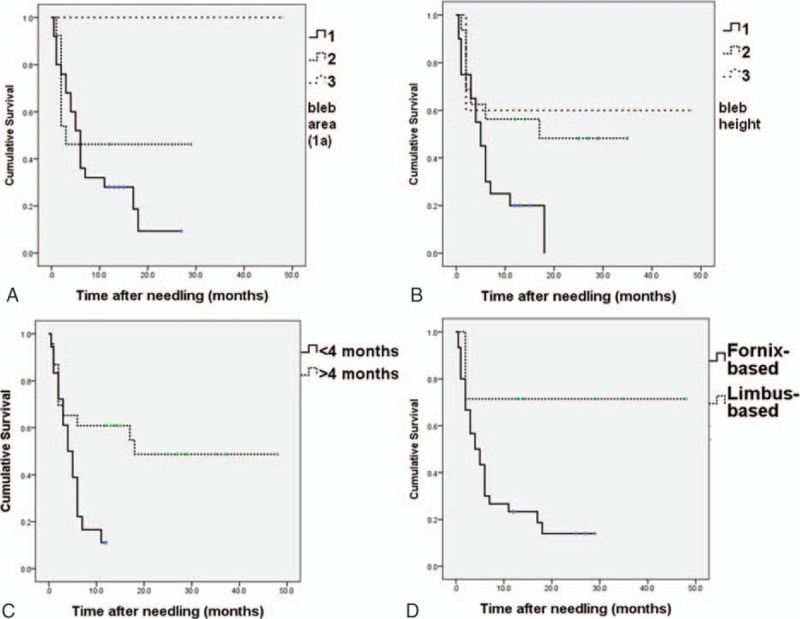
Figure 2.

Kaplan–Meier survival plot for potential risk factors for failure. (A) Different extension of central bleb area (1a) (log-rank test, P = 0.06). (B) Different height of the bleb (log-rank test, P = 0.06). (C) Interval from initial trabeculectomy to needling (log-rank test, P = 0.007). (D) Fornix-based trabeculectomy blebs versus limbus-based blebs (log-rank test, P = 0.02).
