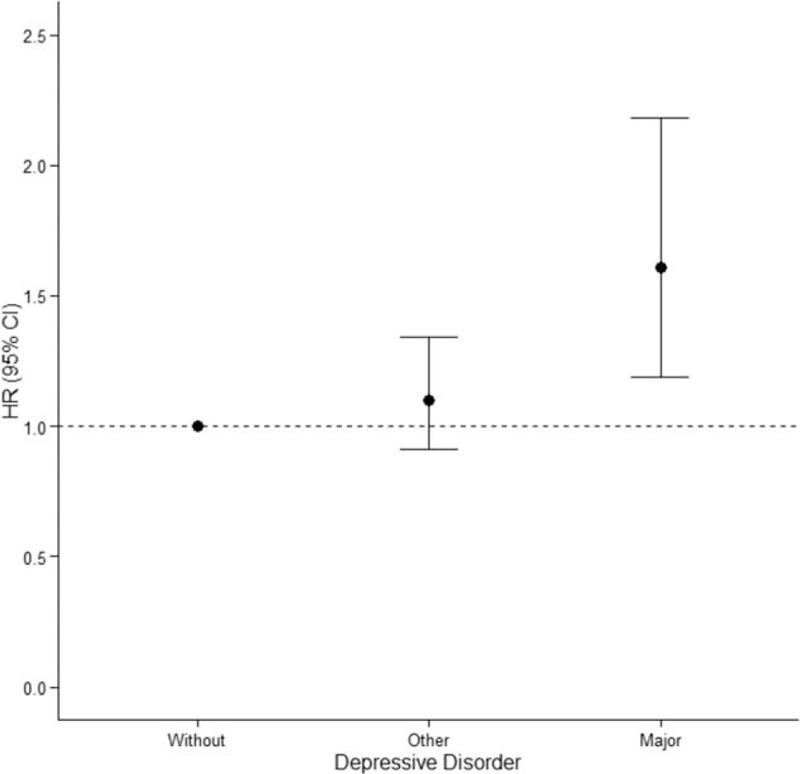
Figure 3.

Hazard ratio and 95% confidence interval of patients with no depression (without); dysthymia/depressive disorder, NOS (other); or major depressive disorder (major). Solid circles represent adjusted hazard ratio. Whiskers indicate 95% confidence interval. The multivariate Cox proportional-hazards analysis was performed after adjusting for sex, age, urbanization, CCI, osteoporosis, and antidepressants.
