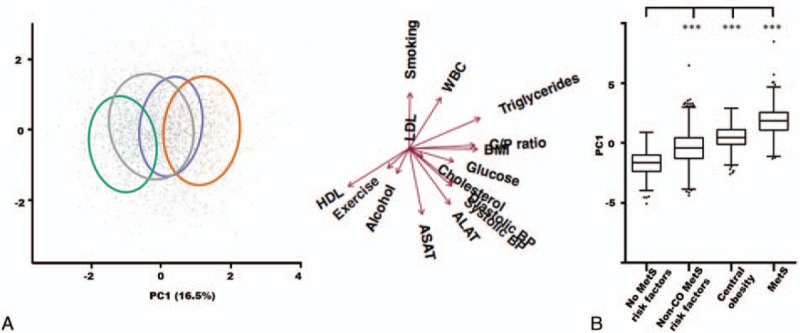
Figure 3.

A heterogeneous metabolic risk profile within the control group. (A) Principal component analysis score plot colored by group: reference group subjects with no metabolic risk factors (green), subjects with risk factors for MetS but no central obesity (gray), subjects with central obesity and up to 1 other MetS risk factor (purple), and subjects with defined MetS (orange). The ellipses cover 68% of the subjects belonging to a given subgroup. Loadings for the included parameters are shown with arrows. ALAT = alanine-aminotransferase, ASAT = aspartate-aminotransferase, C/P ratio = central/peripheral fat mass ratio, cholesterol = total cholesterol, glucose = fasting glucose, WBC = white blood cell count. Exercise: physical activity. (B) Distribution of the principal component 1 scores for the 4 subgroups. Boxes represent the upper quartile, the mean, and the lower quartile of the data. Whiskers designate the Tukey interval with outliers shown as staggered dots. ∗∗∗P < 0.001. MetS = metabolic syndrome, non-CO = non-central obese.
