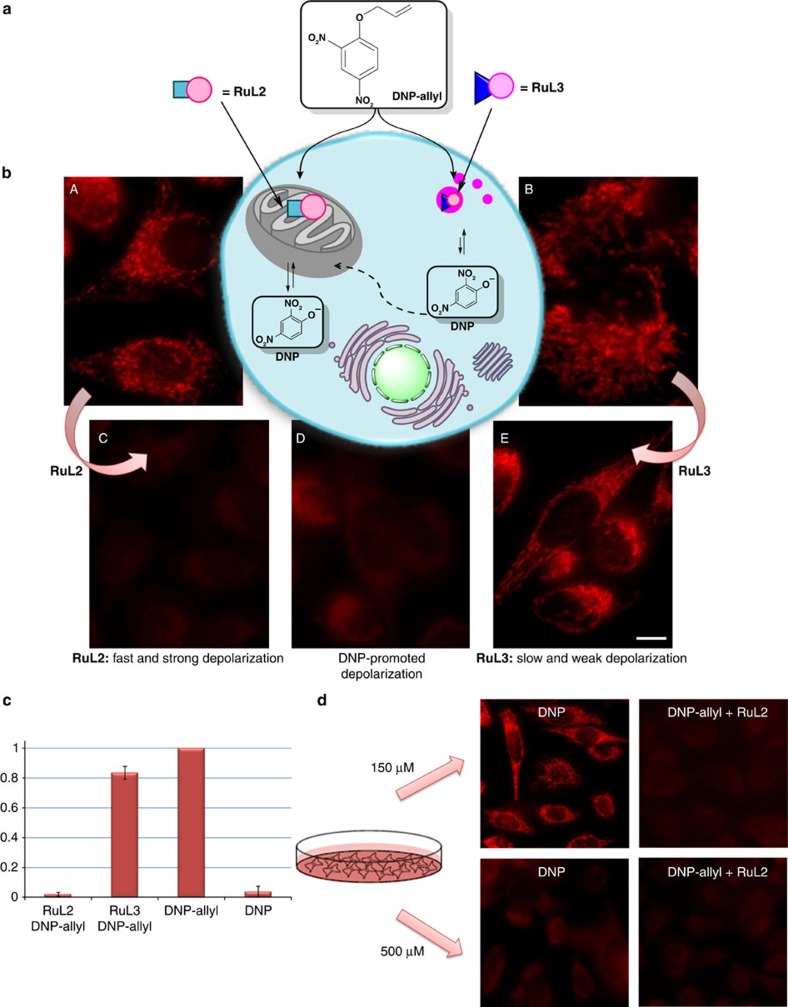
Figure 6. Activation of DNP-allyl inside HeLa cells.
(a) Schematic representation of the uncaging reaction of DNP-allyl with RuL2 and RuL3. (b) Fluorescence micrographs of the mitochondrial staining with TMRE (100 nM) of: (A) cells incubated with RuL2 (50 μM), (B) cells incubated with RuL3 (50 μM), (C) cells treated with DNP-allyl (150 μM) after incubation with RuL2, (D) cells treated with DNP (500 μM) and (E) cells treated with DNP-allyl (150 μM) after incubation with RuL3. (c) Quantification of the fluorescence of the micrographs from section (b) showing the normalized decrease of the TMRE fluorescence. (d) Influence of the concentration of DNP/DNP-allyl on the mitochondrial depolarization of HeLa cells. Scale bar, 12.5 μm. Error bars represent the standard deviation of measurements in three different samples.

