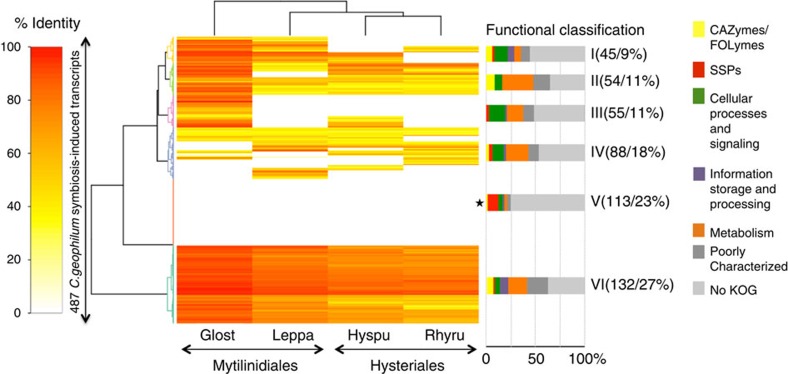
Figure 4. Sequence conservation and functional analysis of symbiosis-induced transcripts.
The heatmap depicts a double hierarchical clustering of 487 symbiosis-upregulated Cenococcum geophilum genes (rows, fold change >5, FDR-corrected P<0.05). Symbiosis-induced genes were blasted (BLASTP) against the genomes of Glonium stellatum (Glost), Lepidopterella palustris (Leppa), Hysterium pulicare (Hyspu) and Rhytidhysteron rufulum (Rhyru) to find homologues (see Supplementary Fig. 6a and b for a comparison with 50 fungal genomes and Supplementary Fig. 6c and d for downregulated genes). Homologues are coloured from yellow to red depending on the percentage of similarity. Left of heatmap, clusters are highlighted by branches of the same colour. Right of heatmap, the percentages of putative functional categories are given for each cluster as bargrams and the number and percentage of genes in each cluster are shown. Clusters significantly enriched in small secreted proteins (SSPs) are marked with an asterisk (Fisher's exact test P<0.01). CAZyme, carbohydrate active enzymes; FOLyme, fungal oxidative lignin-degrading enzymes; no KOG, nonsecreted orphan genes.

