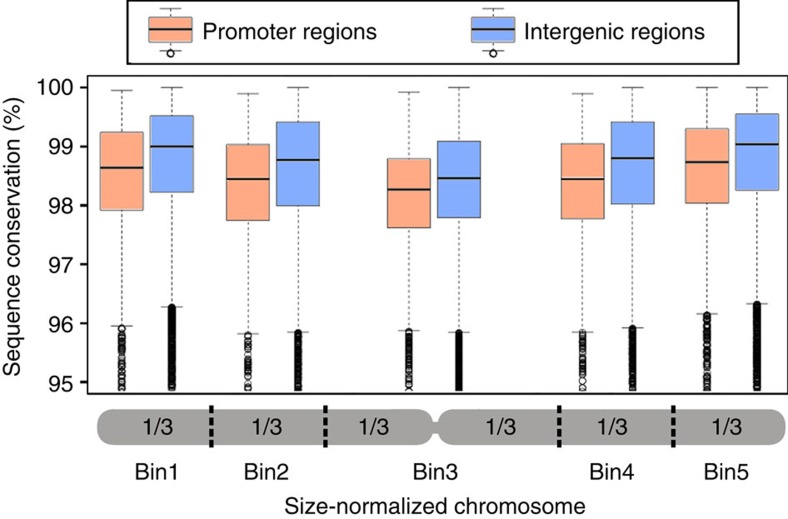
Figure 4. Sequence conservation along Oryza sativa and Oryza glaberrima chromosomes.
Data from all 12 chromosomes were compiled and chromosome sizes were normalized by dividing chromosome arms into three equally sized bins (x-axis). The y-axis depicts sequence identity of orthologous sequences. For each chromosome bin, promoter regions (the 2,000 bp upstream of the transcription start point, red box plots) are compared with intergenic sequences from the same bin (blue box plots). Promoters are on average 20–29% less conserved than intergenic sequences from the same chromosome bin. To calculate sequence conservation in intergenic regions, we isolated segments that are located in the middle of intergenic sequences which are at least 10 kb in size (that is, the distance between the end of one gene and the start of the next one is over 10 kb).

