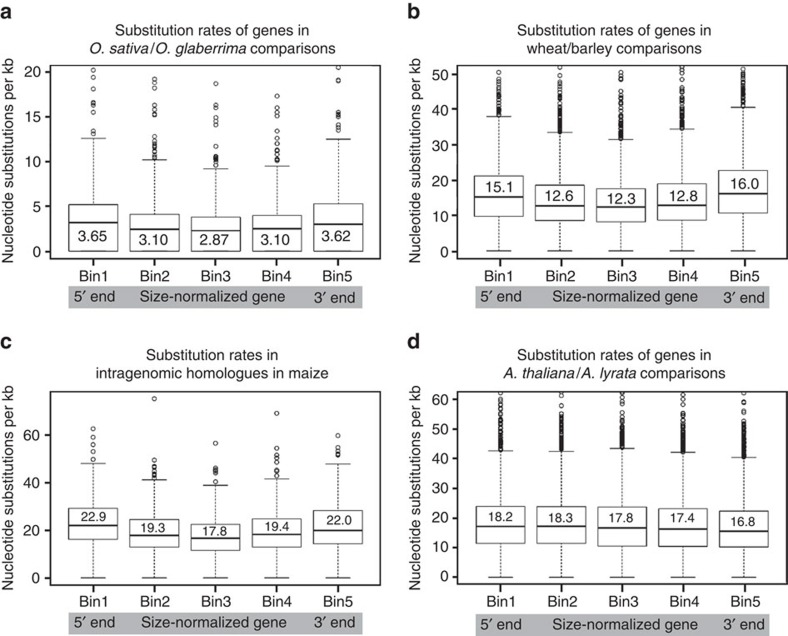
Figure 5. Substitution frequencies in synonymous sites showing that grass genes have higher mutation rates in their 5′ and 3′ regions.
To normalize the different CDS sizes, genes were divided into five equally sized bins and frequencies were normalized to nucleotide substitutions per kb for each bin. The bold line inside the box is the median value, while mean values are indicated with numbers. (a) Comparison of 442 closest homologues from O. sativa and O. glaberrima. (b) Comparison of 2,314 pairs of closest homologues from wheat and barley. (c) Comparison of 428 pairs of intragenomic closest homologues in maize that originate from a whole-genome duplication. (d) Comparison of 4,133 pairs of closest homologues from A. thaliana and A. lyrata.

