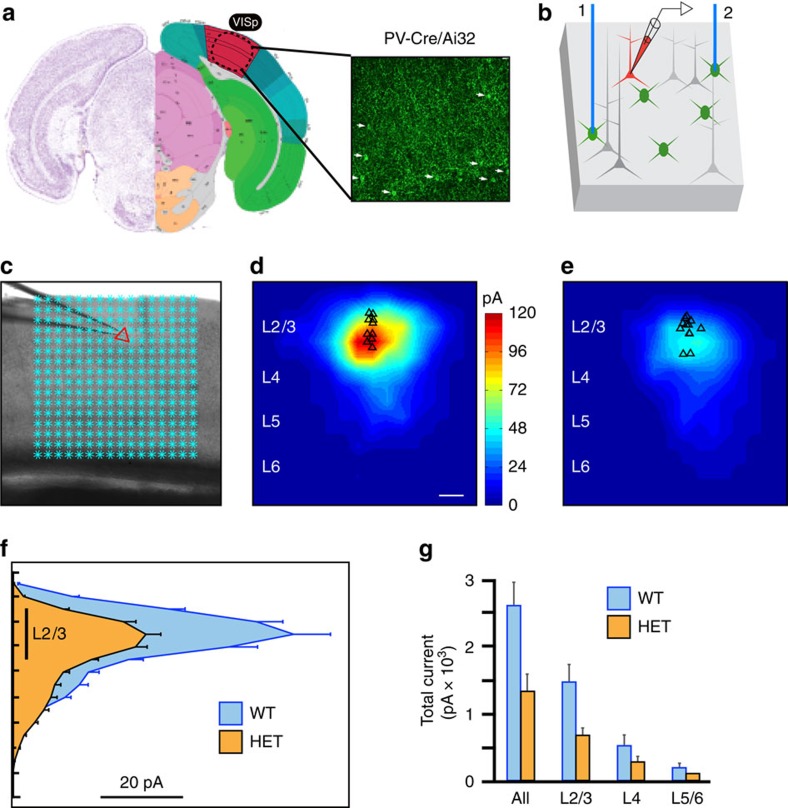
Figure 2. Reduced perisomatic inhibition following single copy Pten deletion from PV cells.
(a) Brain section through visual cortex (delineated in red). The image to the right shows the pattern of YFP-tagged ChR2 expression in PV cells, achieved by crossing PV-Cre and Ai32 mouse lines. Image is not to scale; for illustrative purposes only. (b) Schematic of the ChR2-assisted circuit mapping approach. A pyramidal neuron (red) is recorded in voltage clamp as a blue laser tessellates the cortical slice in a pseudo-random 16 × 16 array, driving somatic spiking activity in ChR2-expressing PV cells. (c) Image of a cortical slice. The silhouette of a patch pipette is visible coming in from the left. The location of the patched pyramidal neuron is marked by the red triangle. Each blue asterisk identifies a unique spot of blue laser illumination. (d,e) Heat maps of inhibitory postsynaptic current strength and position averaged across 10 pyramidal neurons in wild-type mice (d, n=10 cells, 3 mice) and mice hemizygous for Pten in PV cells (e, n=12 cells, 3 mice). Scale bar in (d) is 100 μm. (f) Plot of laminar position (y axis) and summed postsynaptic inhibitory current (x axis), derived from the maps in (d,e). Note the significant loss of PV cell-derived inhibitory input to pyramidal neurons in PV-Pten heterozygous mice. (g) Total PV cell-mediated inhibitory currents from each layer to pyramidal neurons in cortical layer 2/3 in wild-type and PV-Pten heterozygous mice. Plots are mean +/− s.e.m. ** All P=0.01, L2/3 P=0.008; Kruskal-Wallis one-way ANOVA followed by Mann-Whitney U-test.

