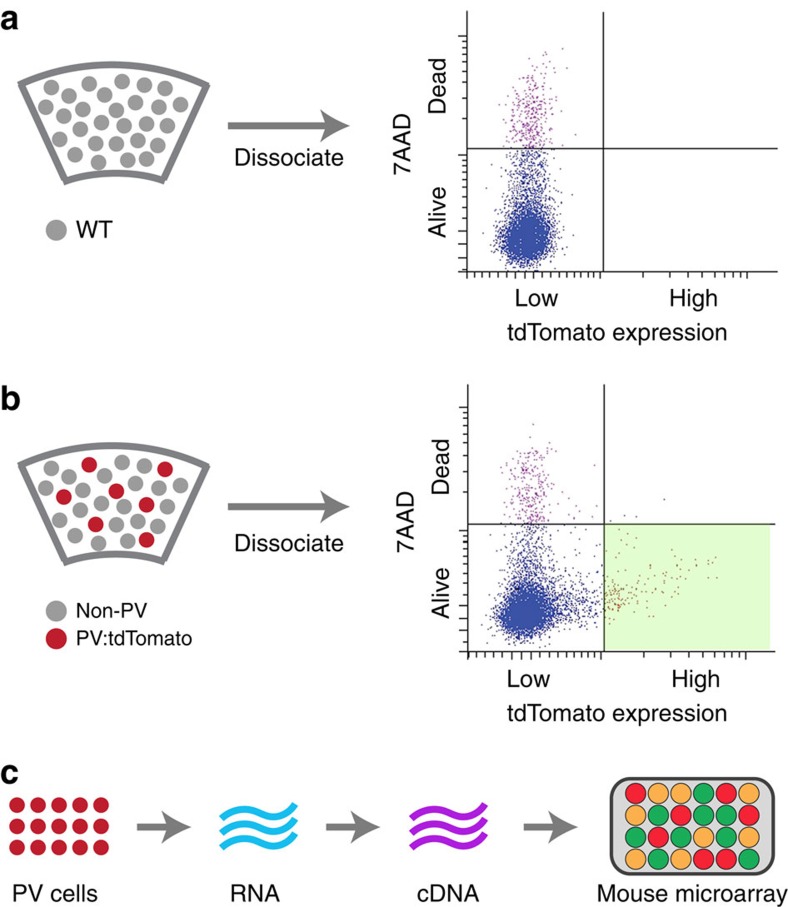
Figure 4. PV cells hemizygous for Pten have increased EphB4 expression.
(a) Left: schematic of a slice through visual cortex. Right: FACS signals for cells dissociated from cortex in a WT mouse with no tdTomato expression in any cortical neurons. Ordinate: log scale of brightness of 7AAD fluorescence staining; Horizontal line defines boundary used to separate live from dead cells. Abscissa: log scale of tdTomato fluorescence; Vertical line defines the boundary, later used in panel (b) to distinguish tdTomato-expressing cells. (b) Example of FACS signals for cells dissociated from cortex in a PV-Cre/Ai9 mouse expressing tdTomato in PV cells. The lower right quadrant identifies the levels of 7AAD staining and tdTomato expression used to separate living, tdTomato-expressing PV cells. (c) Schematic of the process used to create and quantify cDNA libraries from PV cells in normal mice and mice hemizygous for Pten in PV cells. FACS, fluorescent-activated cell sorting.

