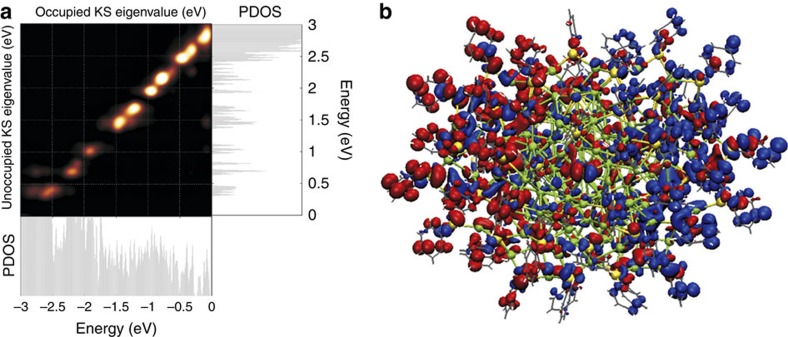
Figure 6. Analysis of the peak at 425 nm (2.9 eV) in the time-dependent DFT (TDDFT) optical spectrum of Ag136.
(a) The transition contribution map shown on the top left reveals that this peak consists of a large number of single-electron particle-hole transitions. Holes are created for states from the Fermi level down to about −2.5 eV (horizontal projected densities of electron states (PDOS) plot) and particles are created for states from the lowest unoccupied molecular orbital (LUMO) state up to ∼2.9 eV (vertical PDOS plot). In that energy range, both silver core states and ligand (sulfur and the pi-system of the phenyl) states are active and the total transition is a mixture of Ag(5 s) to ligand, ligand to Ag(5 s), ligand to ligand and Ag(4d) to Ag(5 s) contributions. (b) The induced transition density shows the collective dipole oscillation. Blue and red colours indicate mean deficit and surplus of electron density, respectively.

