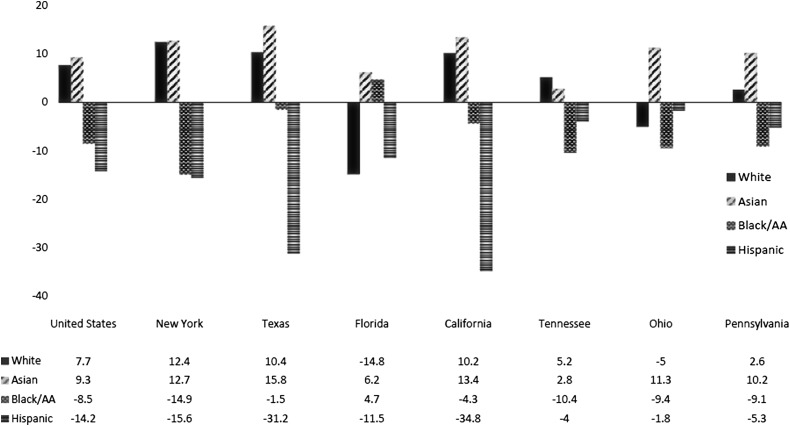
Figure 2.
Ethnic/Racial Composition in Schools/Colleges of Pharmacy in States with at Least Five Schools of Pharmacy23,24 (Numbers represent the difference between the percentages of select populations in US states and their representation in colleges of pharmacy within the state. A negative number signifies underrepresentation, positive numbers signify overrepresentation, when compared with US Census Bureau state data).

