Figure 5.

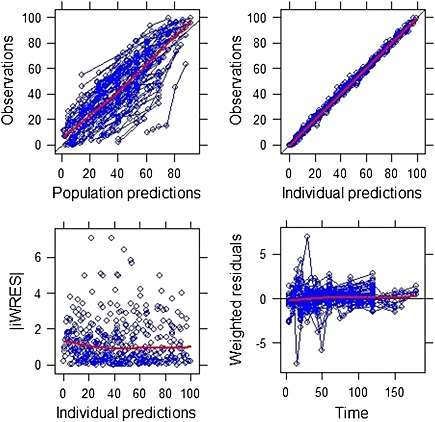
Goodness of fit plots showing population and individual predictions, individual weighted residuals against individual predictions and weighted residuals against time. Lines are the best fit to the data

Goodness of fit plots showing population and individual predictions, individual weighted residuals against individual predictions and weighted residuals against time. Lines are the best fit to the data