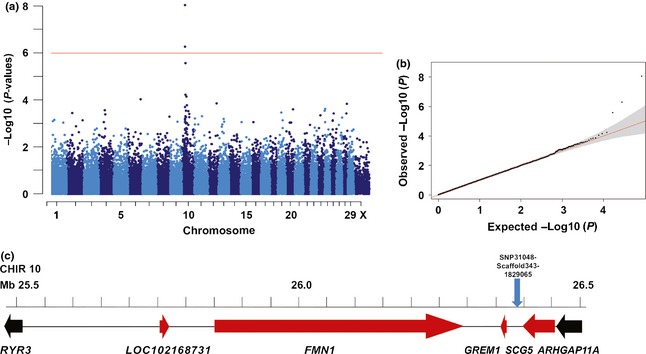
Figure 2.

Genome‐wide association study for wattles in goats. (a) The red line in the Manhattan plot indicates the Bonferroni significance threshold for association (−log10 P = 5.99) showing two genome‐wide significantly associated SNPs on CHIR 10. (b) The quantile–quantile (QQ) plot shows the observed vs. expected log P‐values. The straight red line in the QQ plot indicates the distribution of SNP markers under the null hypothesis, and the skew at the right edge indicates that these markers are more strongly associated with the trait than would be expected by chance. (c) Gene content of the associated region. The most significantly associated SNP is shown as the blue arrow. For the mutation analysis, the region containing the genes shown in red between RYR3 and ARHGAP11A was considered.
