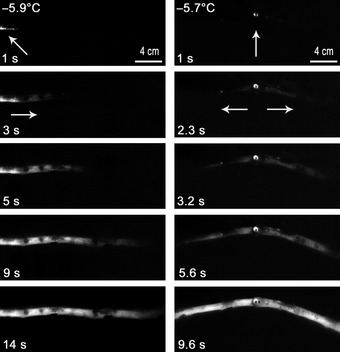
Figure 2.

Typical ice propagation monitored by infrared thermography in branches from Picea abies after artificial ice nucleation at one end (left column) or in the centre of the sample (right column). Arrows indicate ice nucleation points and directions of ice propagation. In the image sequence, the temperature at the time of nucleation and the time after nucleation(s) are given.
