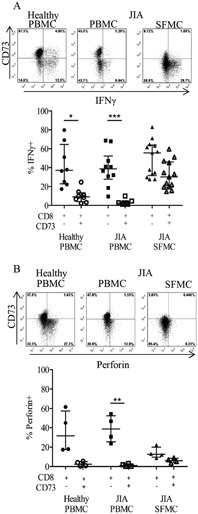
Figure 5.

Lack of coexpression of CD73 with the inflammatory and cytotoxic markers interferon‐γ (IFNγ) and perforin on CD8+ T cells. A, Top, Low levels of coexpression of CD73 and IFNγ on CD8+ T cells in healthy control PBMCs or PBMCs and SFMCs from JIA patients after stimulation of the cells with phorbol 12‐myristate 13‐acetate and ionomycin. Representative plots from fluorescence‐activated cell sorter (FACS) analysis gated on CD3+CD8+ cells are shown. Bottom, Percentage of IFNγ+ cells within the CD8+CD73− or CD8+CD73+ population in healthy PBMCs (n = 8) and PBMCs (n = 9) and SFMCs (n = 12) from JIA patients. B, Top, Lack of coexpression of the cytotoxic protein perforin and CD73. Representative FACS plots gated on CD3+CD8+ cells are shown. Bottom, Percentage of perforin‐positive cells among healthy PBMCs (n = 4) and PBMCs (n = 7) and SFMCs (n = 6) from JIA patients. Bars show the median with interquartile range. ∗ = P < 0.05; ∗∗ = P < 0.001; ∗∗∗ = P < 0.0001. See Figure 1 for other definitions.
