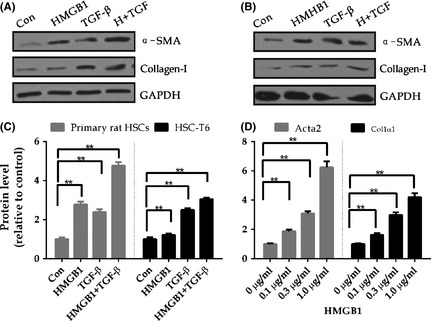
Figure 3.

High Mobility Group Box 1 activates HSCs. (A) Primary rat HSCs on day 4 or (B)HSC‐T6 were treated with 1 μg/ml HMGB1, TGF‐beta alone or both as indicated for 24 hours. Western blotting analysis of α‐SMA and Collagen‐1 with specific antibody as indicated, with GAPDH as a loading control. Images presented are representative of three independent experiments. Protein α‐SMA ratios (normalized to GAPDH) were used to quantify fold change relative to control and are shown(C). (D)Quantitative real‐time reverse PCR analysis transcript level of α‐SMA(Acta2) and procollagen 1a1, normalize to housekeeping gene Gapdh in rat hepatic stellate cells treated with indicated concentration of HMGB1 for 6 hours. Data represented the mean value of three experiments, error bars indicate SME, *, P < 0.05,**, P < 0.01.
