
Figure 2.
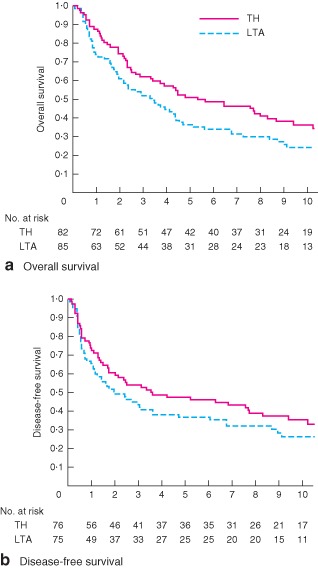
Kaplan–Meier curves of a overall and b disease‐free survival in all randomized patients by treatment group. TH, transhiatal approach; LTA, left thoracoabdominal approach. a Hazard ratio (HR) 1·42 (95 per cent c.i. 0·98 to 2·05; P = 0·970 and P = 0·060, 1‐ and 2‐sided log rank test respectively); b HR 1·28 (0·87 to 1·89; P = 0·892 and P = 0·215, 1‐ and 2‐sided log rank test respectively)