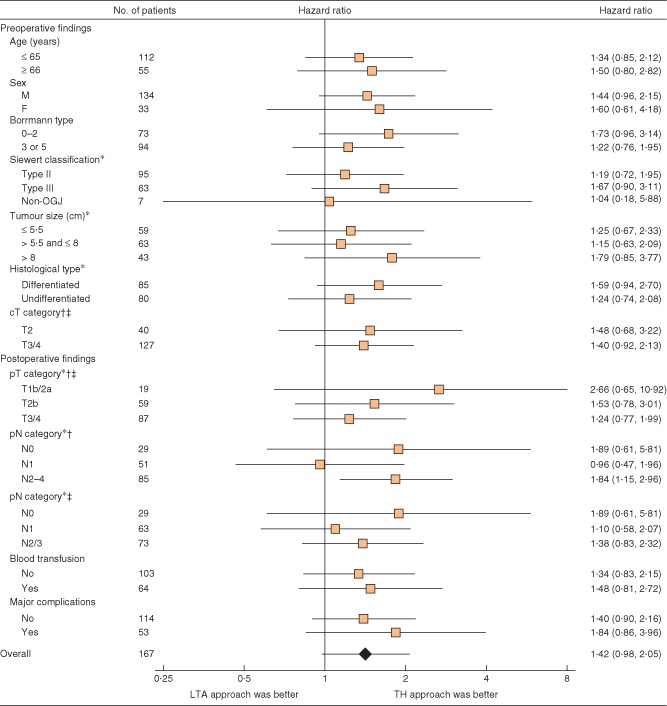
Figure 3.

Forest plot for overall survival in the subgroup analysis. *Data not available for two patients in the left thoracoabdominal (LTA) group who did not undergo surgical resection owing to M1 disease. Hazard ratios are shown with 95 per cent c.i. OGJ, oesophagogastric junction; TH, transhiatal. †Japanese Classification of Gastric Carcinoma, 12th edition16; ‡International Union Against Cancer (UICC) TNM classification, 6th edition17
