
Figure 4.
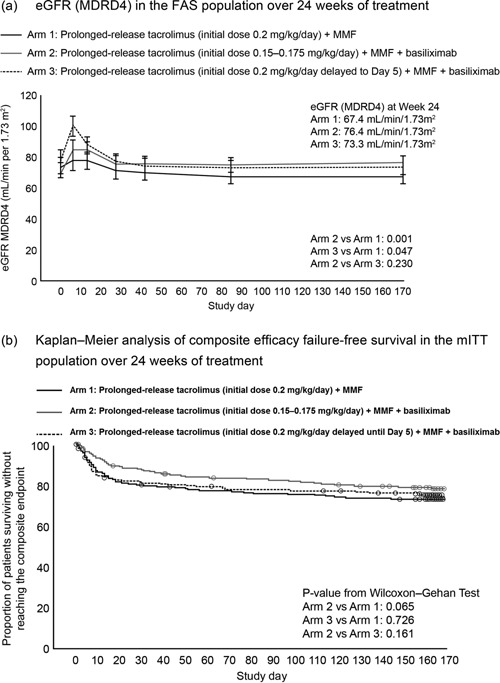
(a) eGFR (MDRD4) in the FAS population, and (b) Kaplan–Meier analysis of composite efficacy failure‐free survival in the mITT population, over 24 weeks of treatment. Data in Figure 4a are represented as least‐square means and error bars represent standard error of the mean. eGFR, estimated glomerular filtration rate; FAS, full‐analysis set; MDRD4, Modification of Diet in Renal Disease‐4; mITT, modified intent to treat; MMF, mycophenolate mofetil.